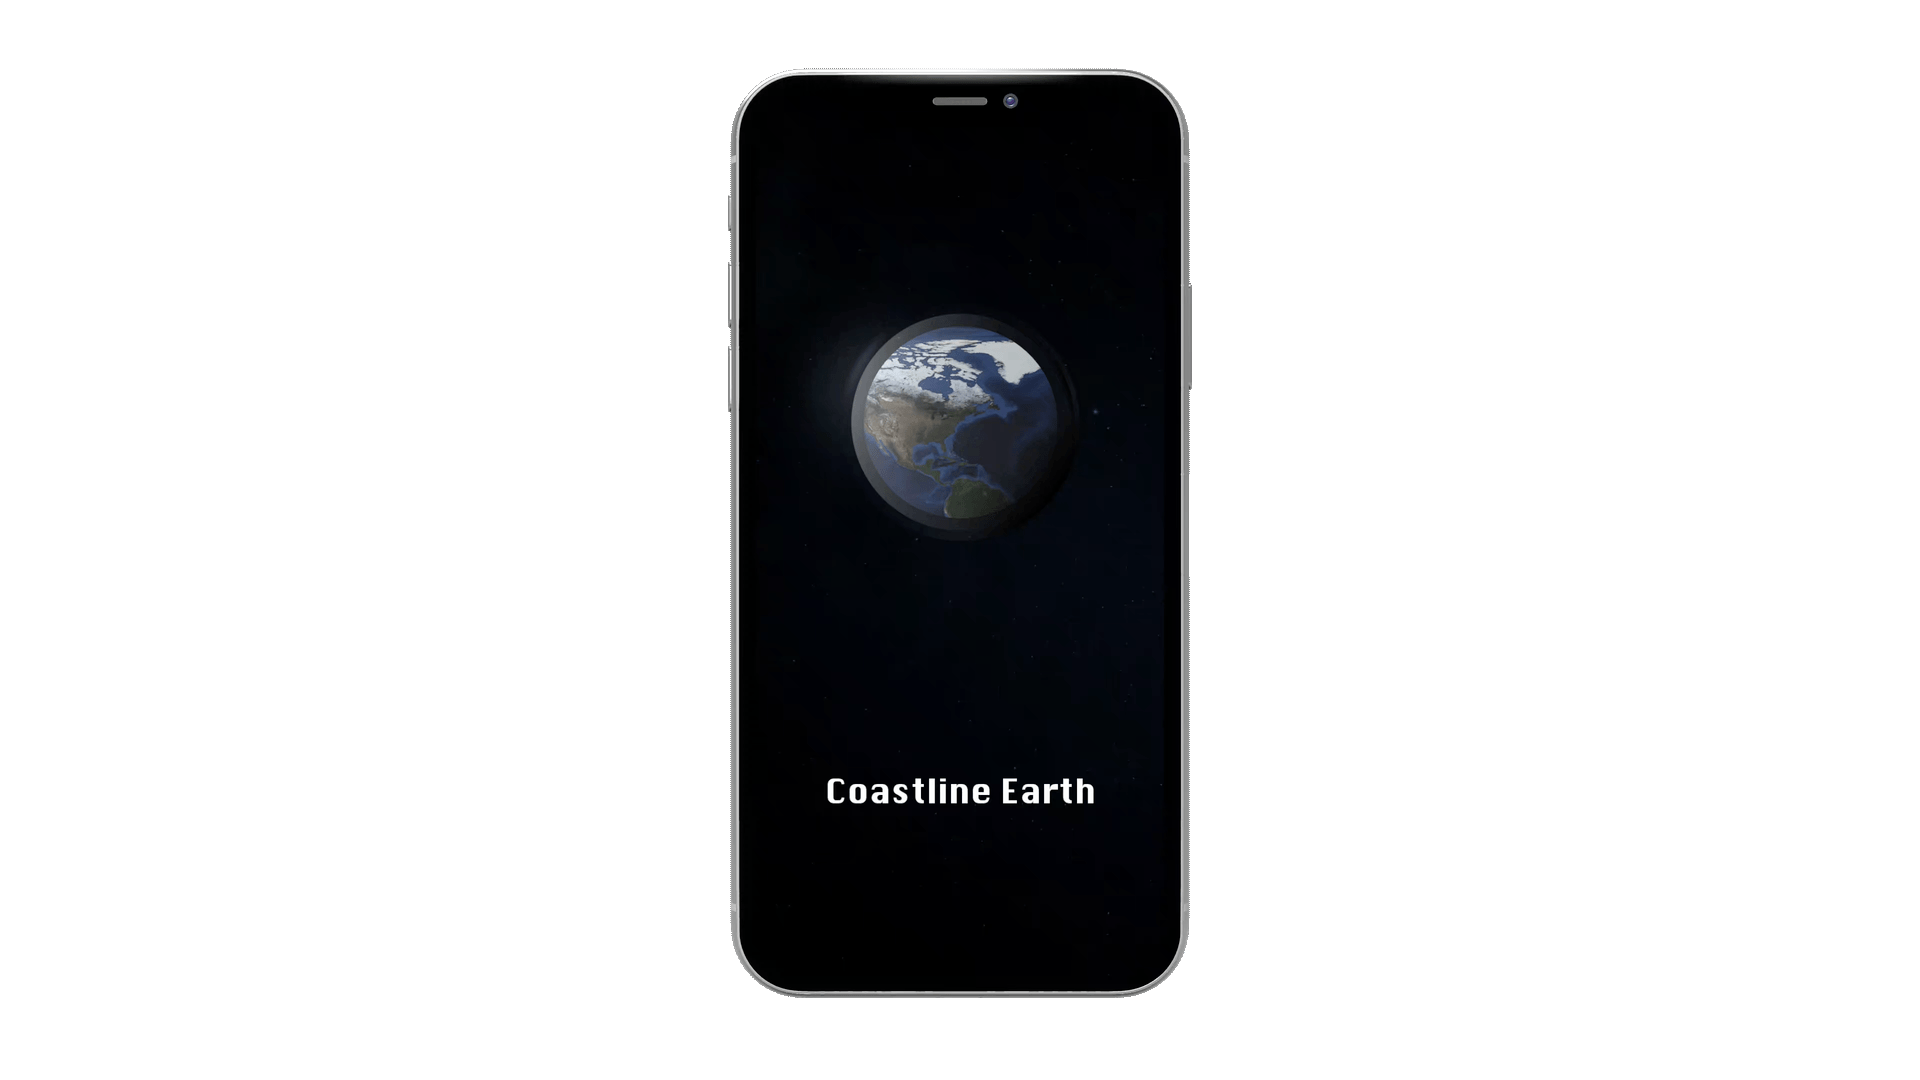
COASTLINE
An app can access coast weather forecasts and receive precise weather conditions through a customizable notification. Help water sports lovers find a safe place to take water adventures based on their preference and location.
BACKGROUNDHow dangerous are water sports? Many people drown while playing water activities each year, leading to anoxic severe brain injuries and even deaths. Besides adhering to safety standards, keeping an eye on the weather condition is essential for planning your next water adventures.
CHALLENGE & PROBLEMSLocating a water spot to go to or finding the coastal weather forecast that suits your water sports skill can be a time-consuming task. Spending hours with a complex display searching for wind speed or surfing breaks and still coming up empty-handed is quite frustrating. How safely to spend your day on your favorite water sport activities is a priority thing you should consider.
MY ROLEUX & UI Design
CLIENTIndividual Project
TOOLSAdobe XD | InVision | Marvel
Google form | OptimalSort
UsabilityHub | QuickTime player
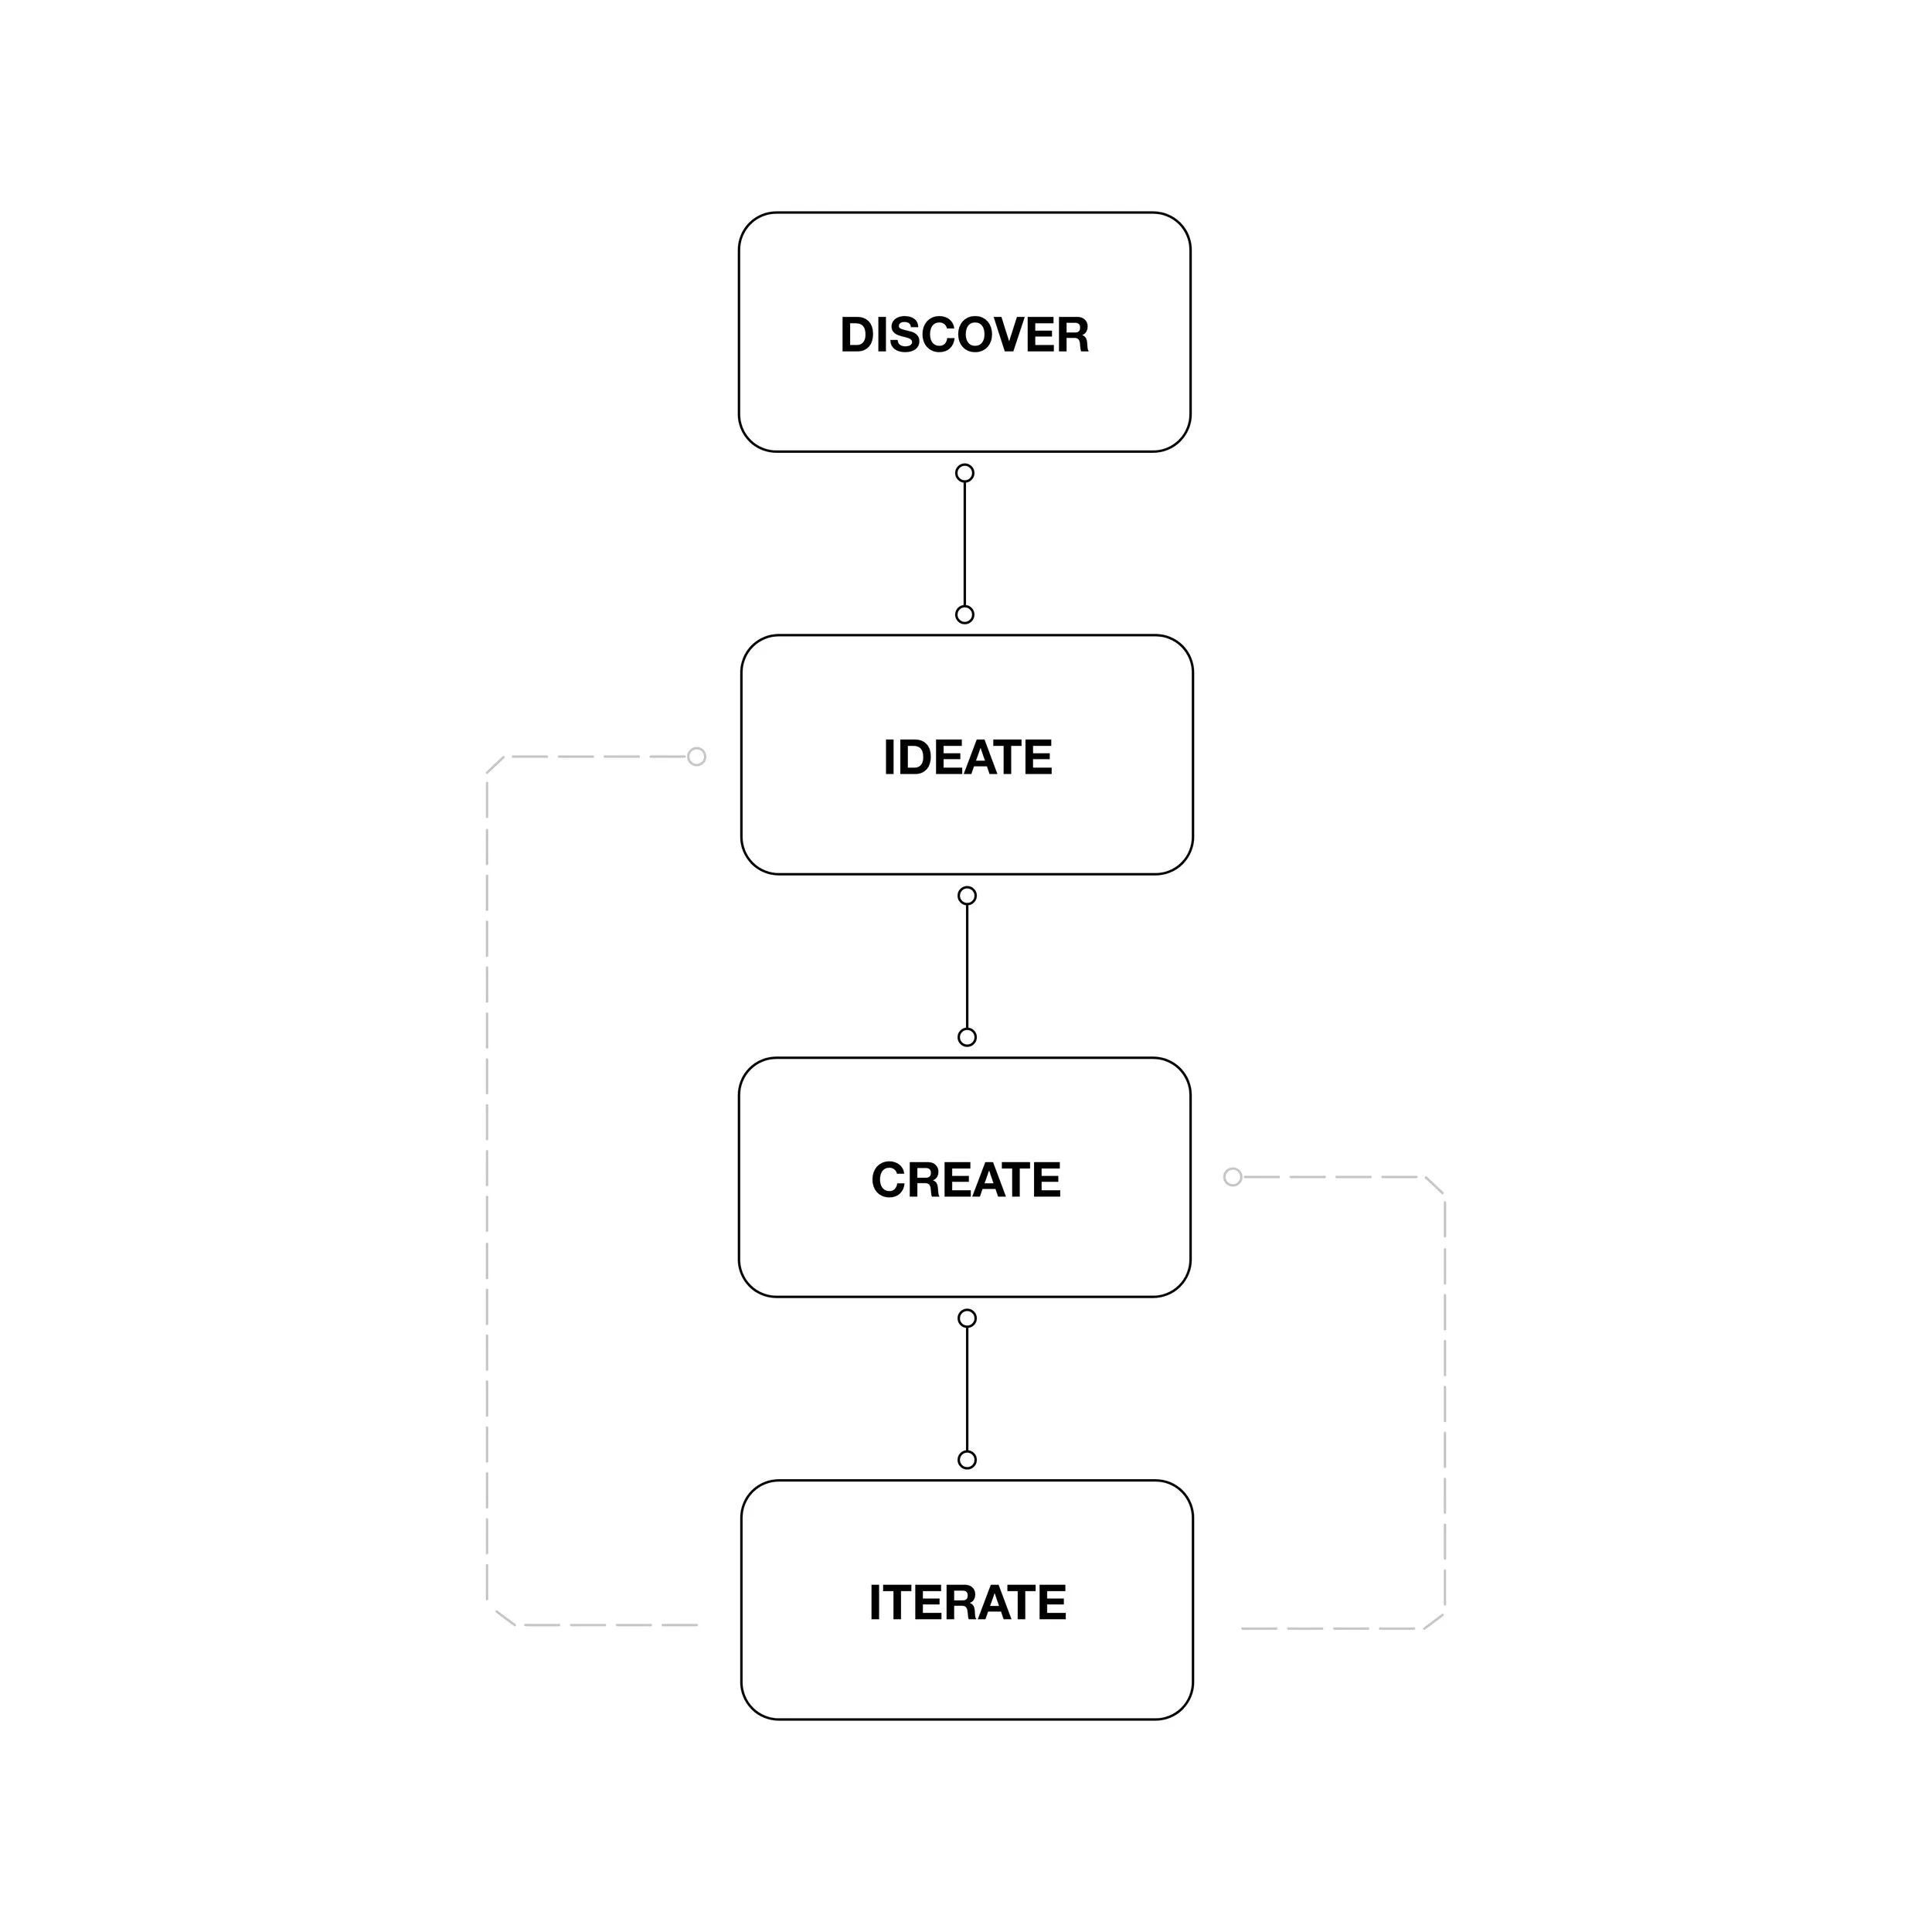
THE APPROACHThis project applied the user-centered design process to solve the problems.
I was collected the data from user research and market research in the discovery stage. Synthesized information to ideate the core problems. Created the wireframes and prototypes based on the IA and tested and iterated the product during the design process.

SOLUTIONSBuild an application that helps users safely plan on the water with their loving friends and family.
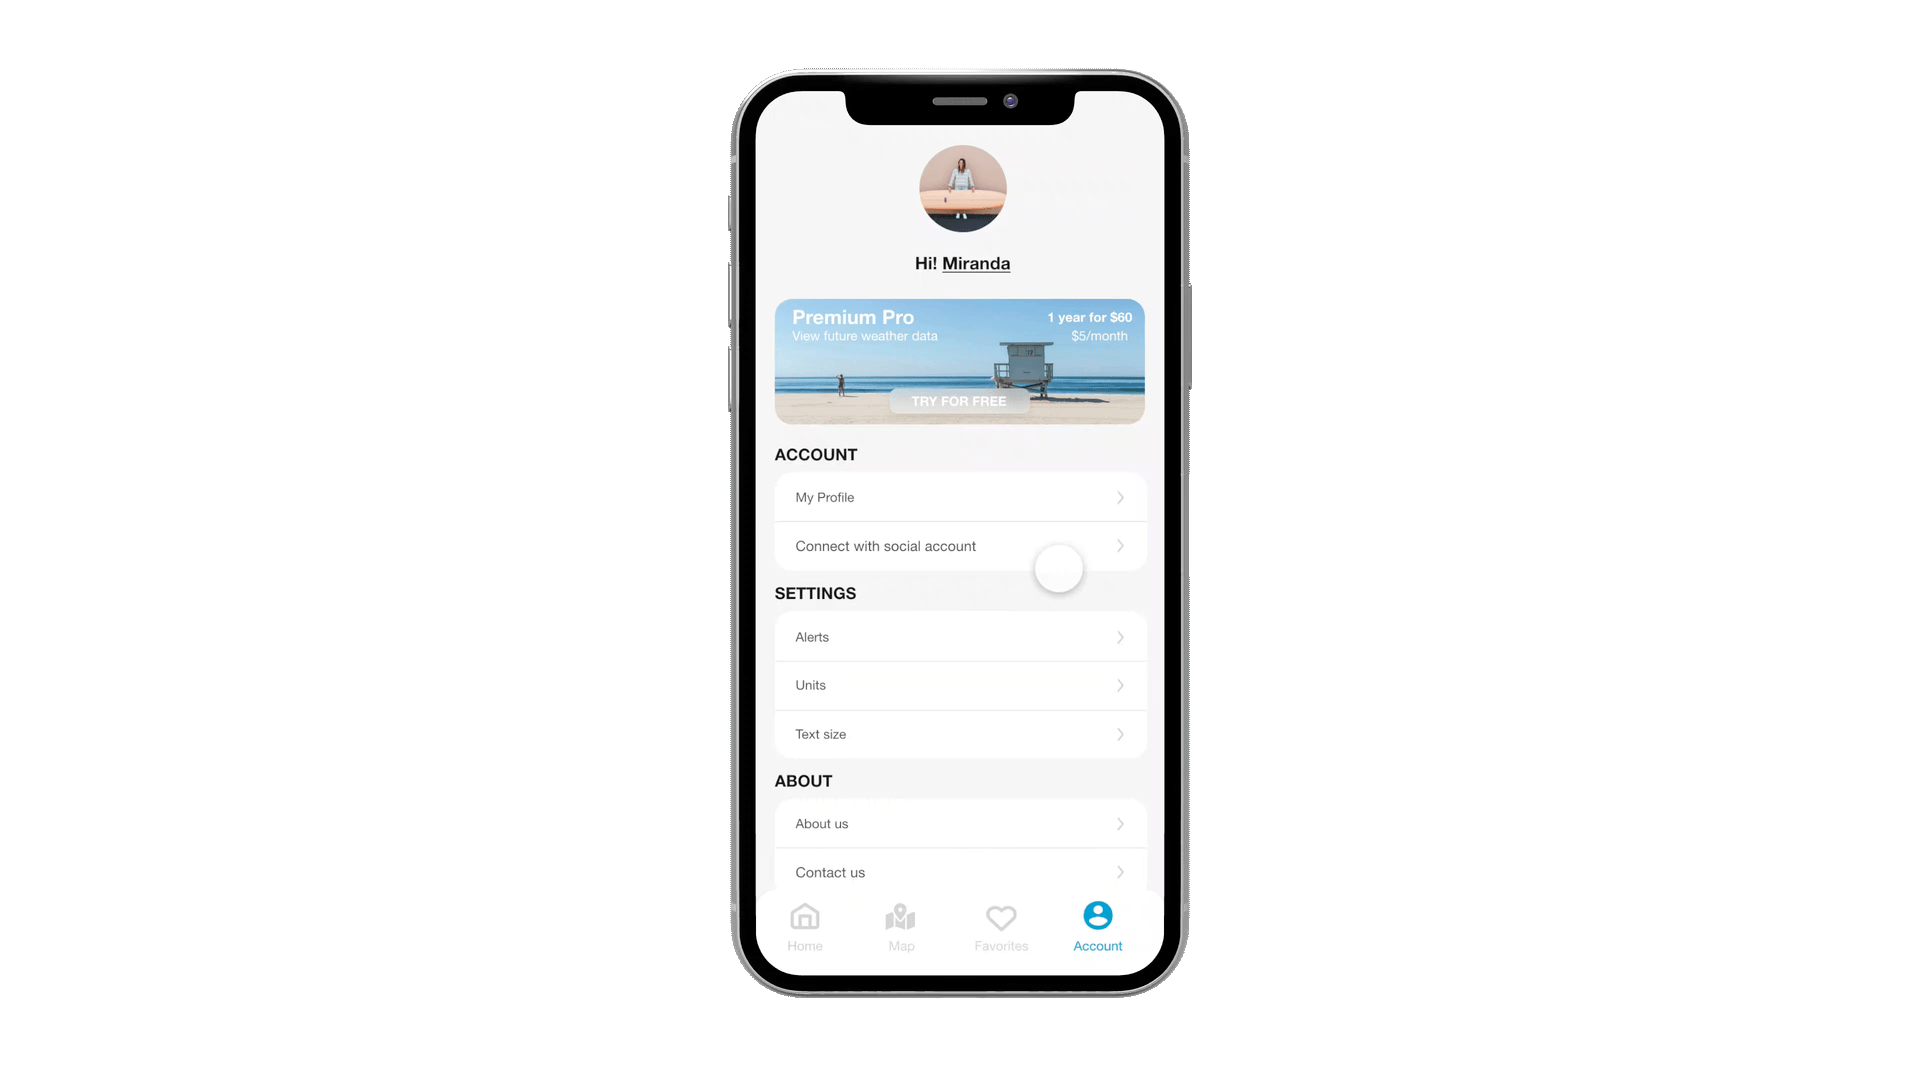
A friendly interface and an easy-to-comprehend display.
Where users to locate a spot quickly based on their preference and location.
A customizable weather feature to get notifications when specific criteria meet the standards set up by users.
Receiving the latest Coastal and Offshore Warnings.
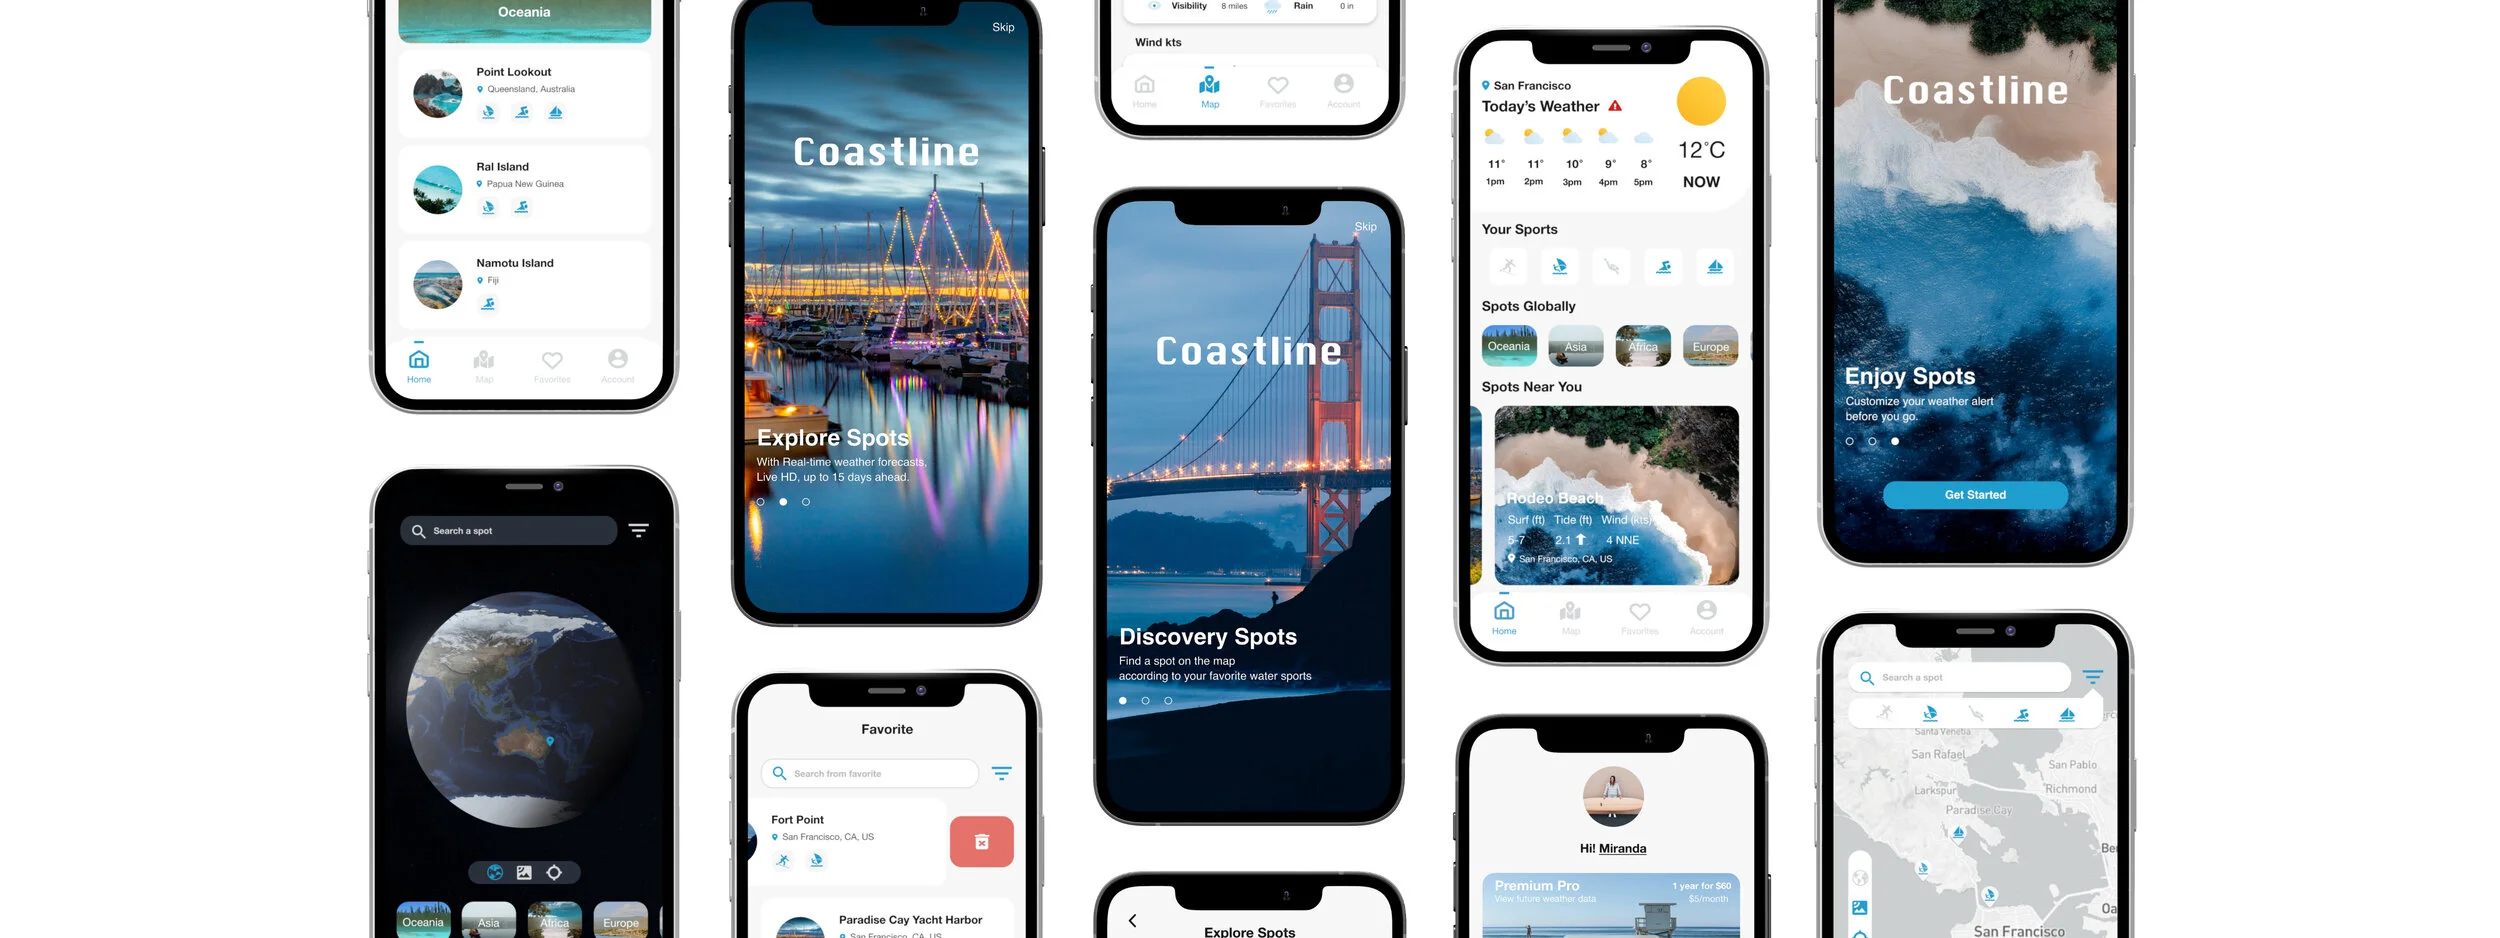
KEY FEATURE 1: Sports Preference
If users having trouble locating a place, they can choose a spot based on their water sports preference.
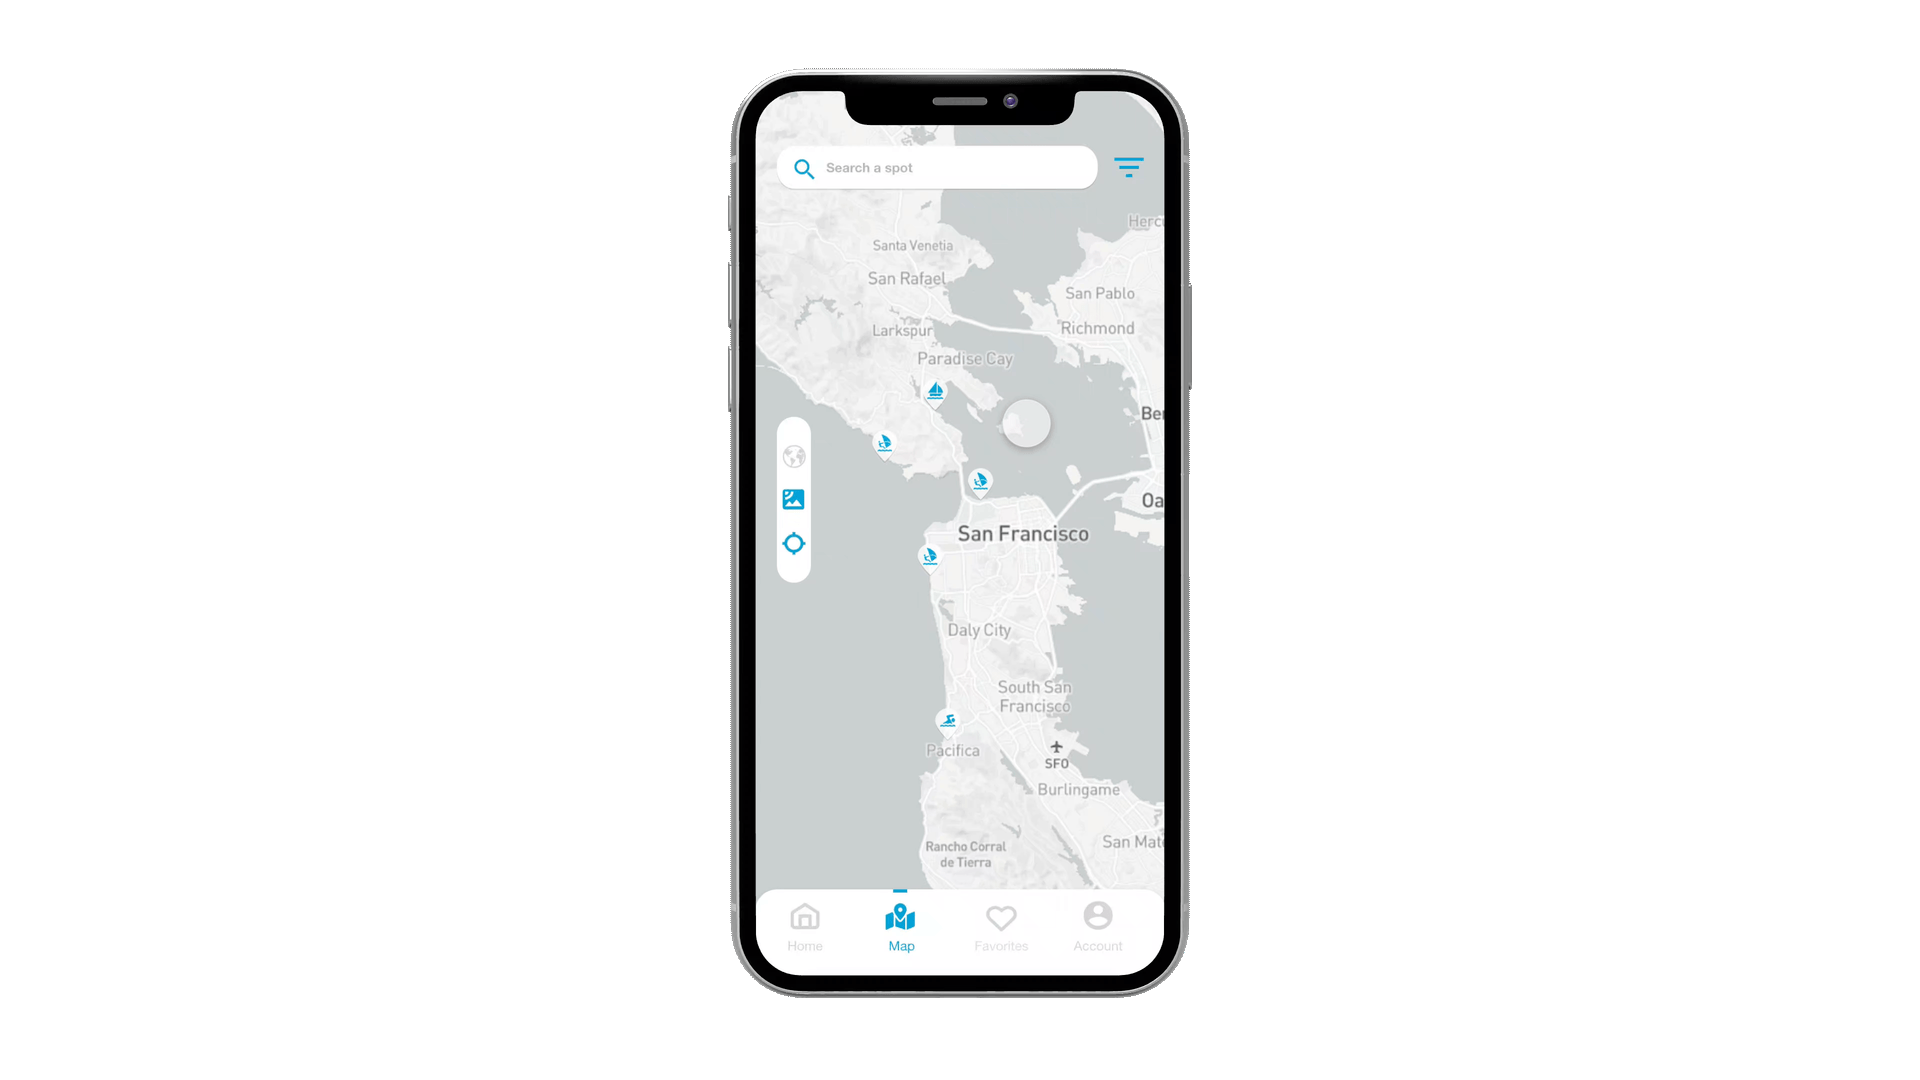
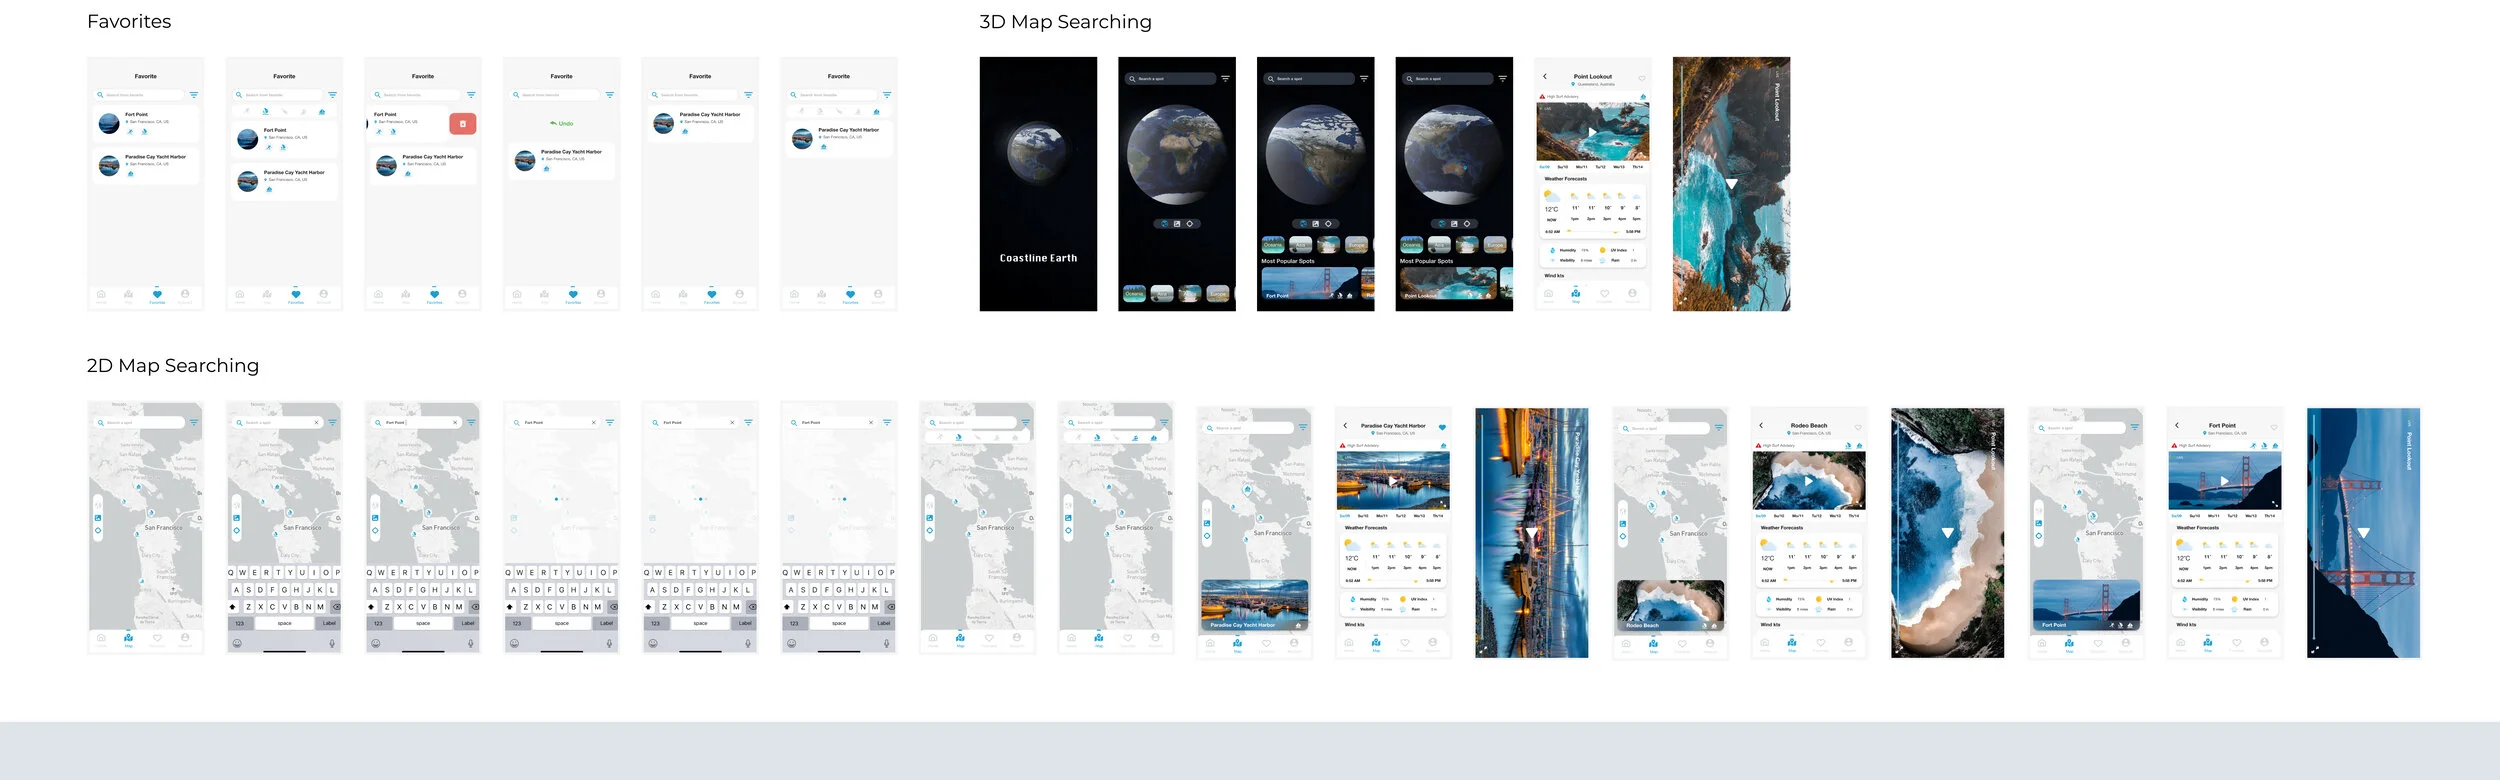
KEY FEATURE 2:Locate Water Spots
Users can explore the map and find the world's best water sports destinations.
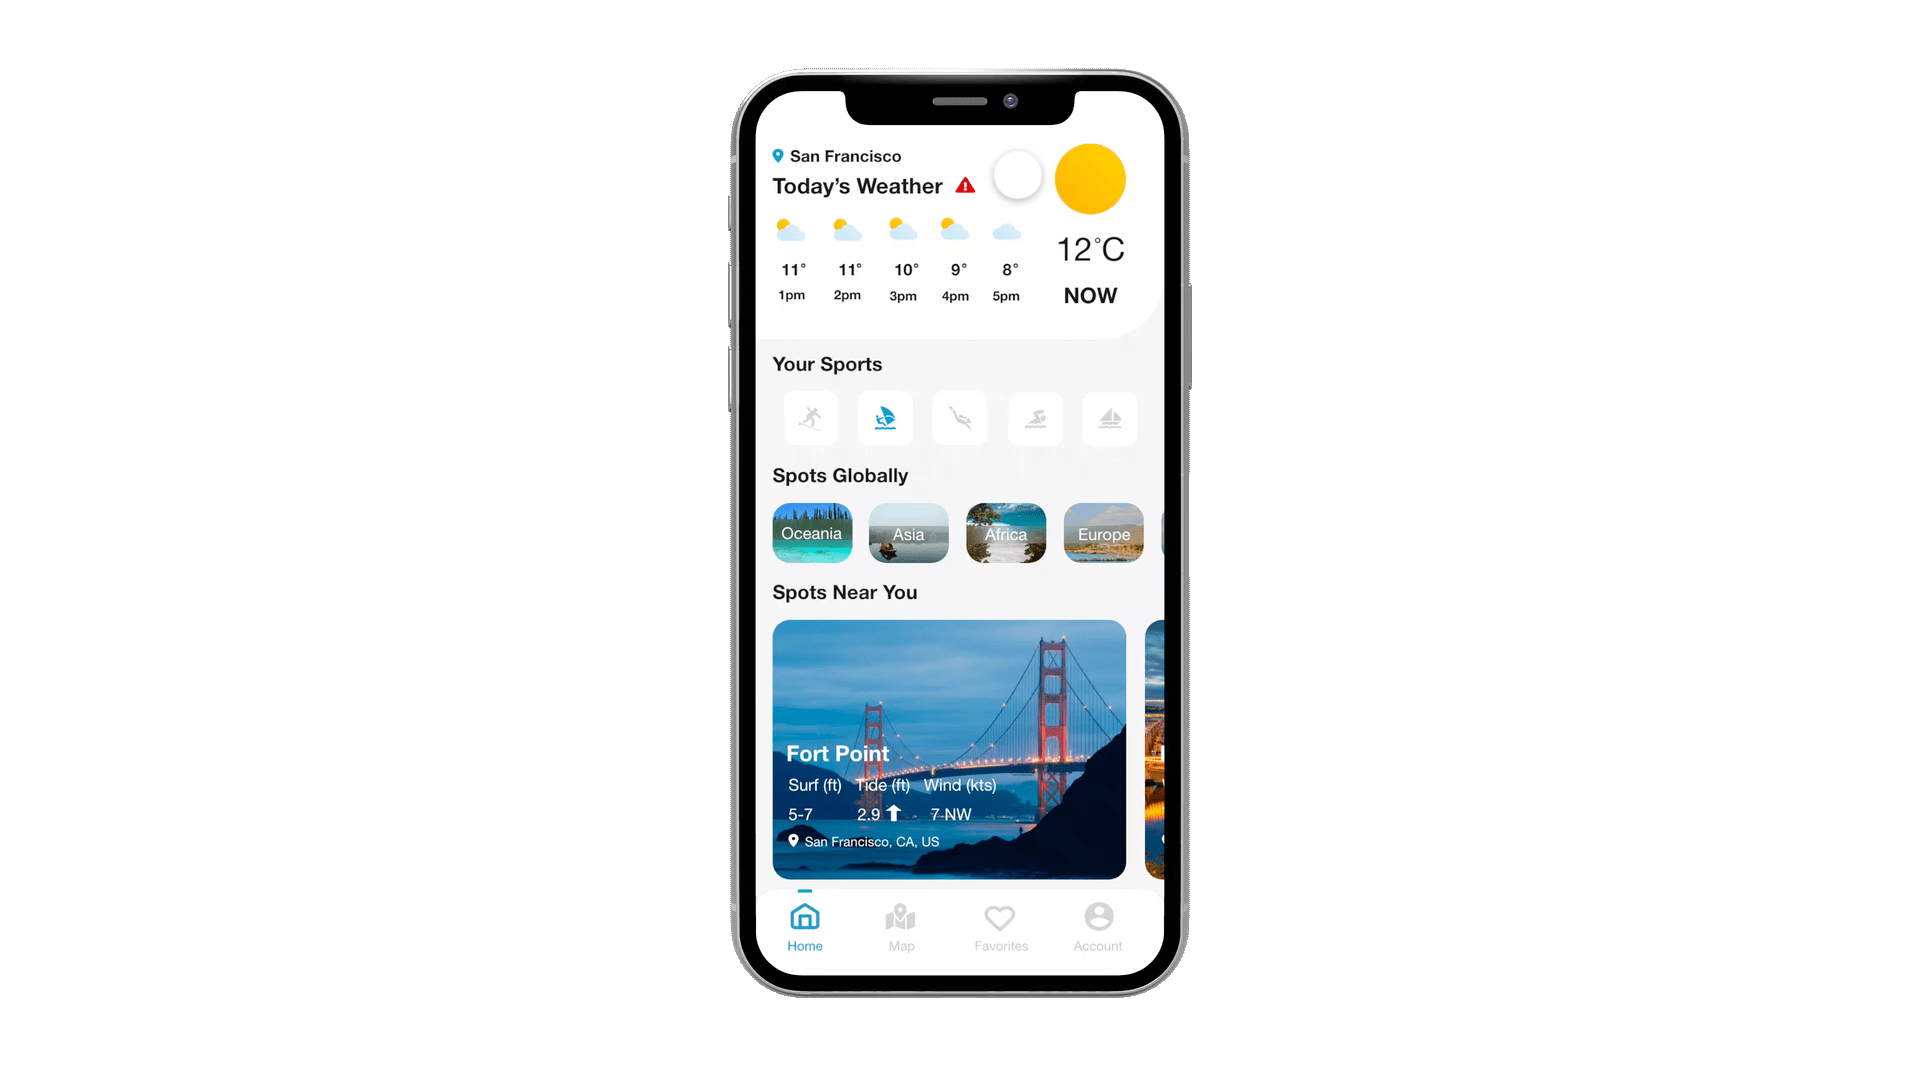
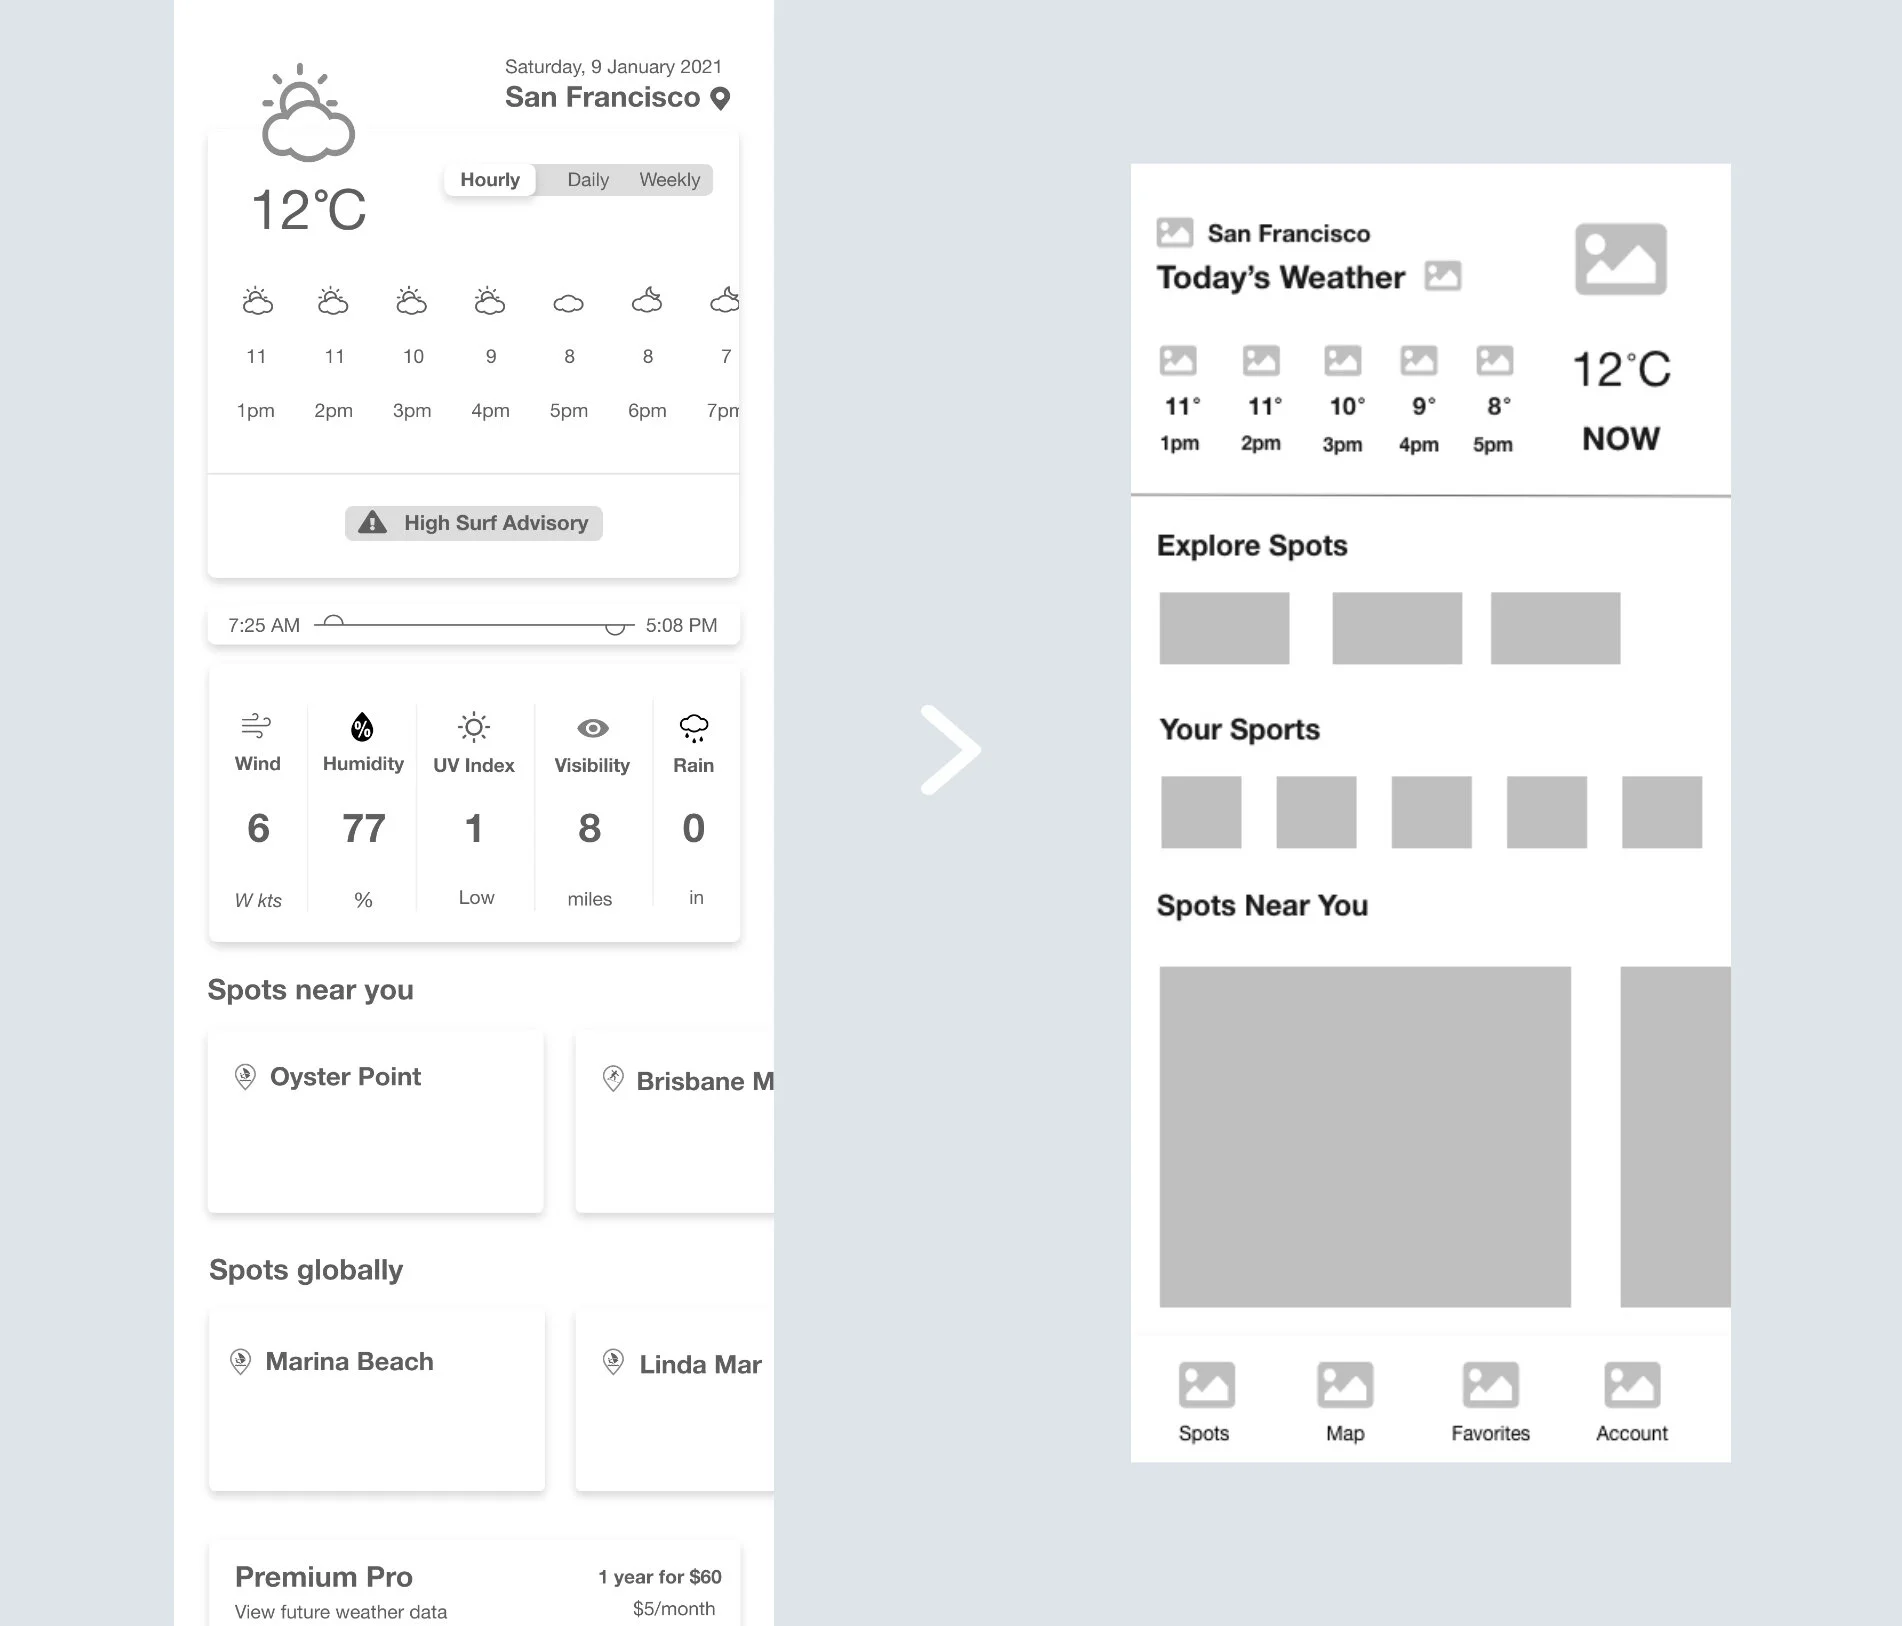
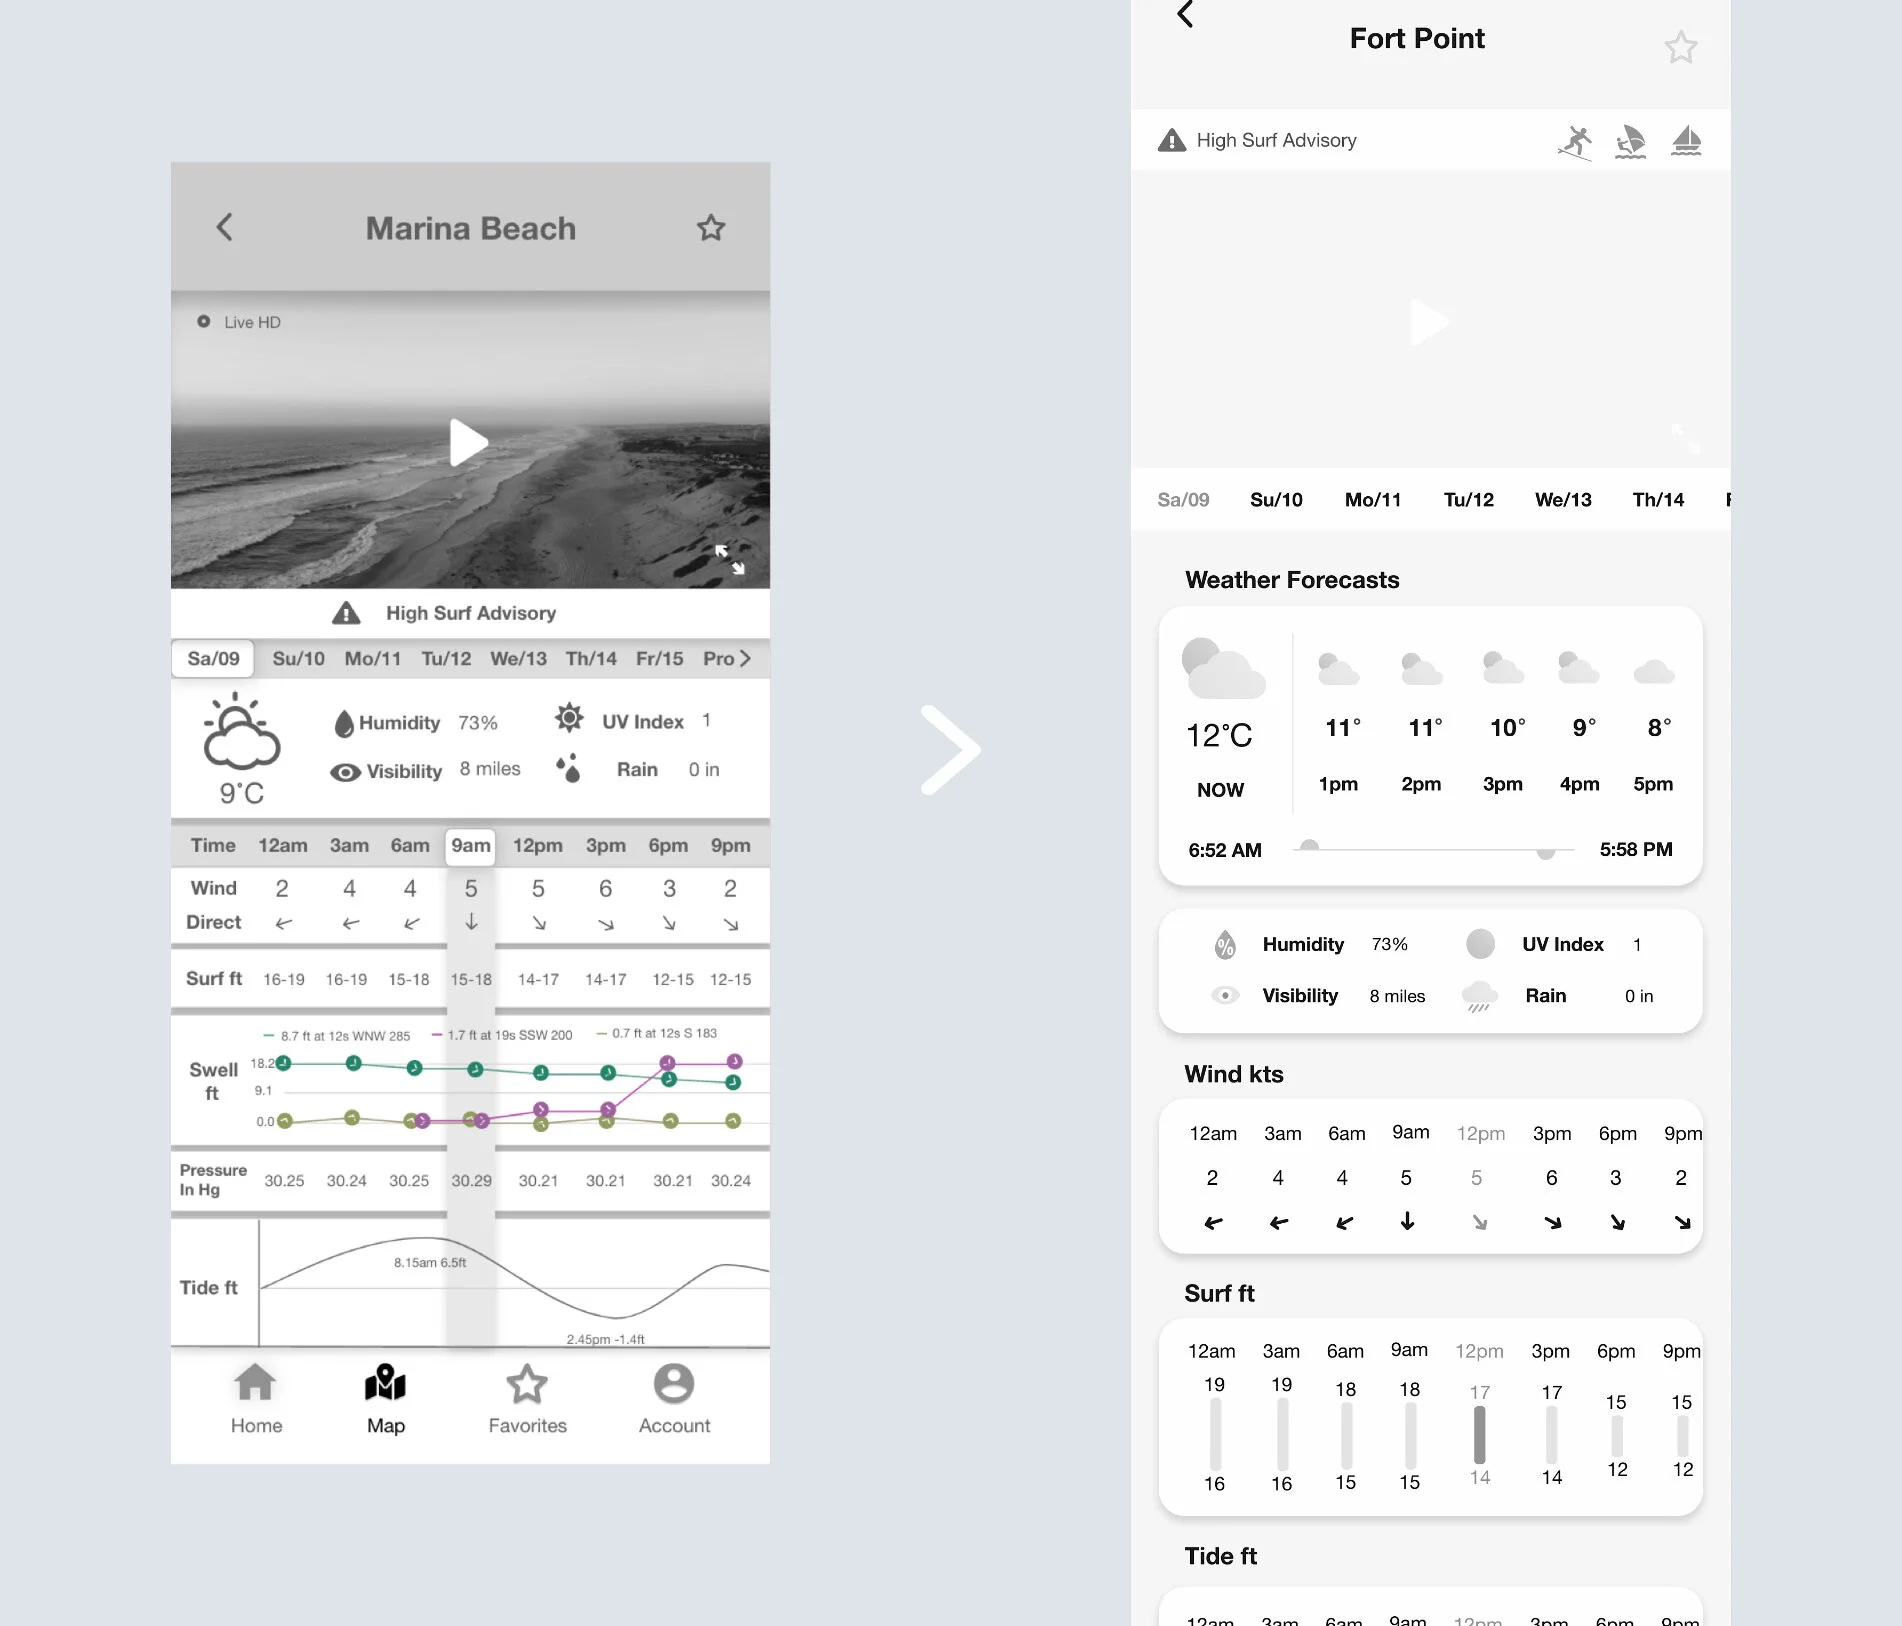
KEY FEATURE 3: Weather Forecasts
The forecasting screen presents the information within the next 7 days. Highlighting the real-time data in a different color with graphical appealing.
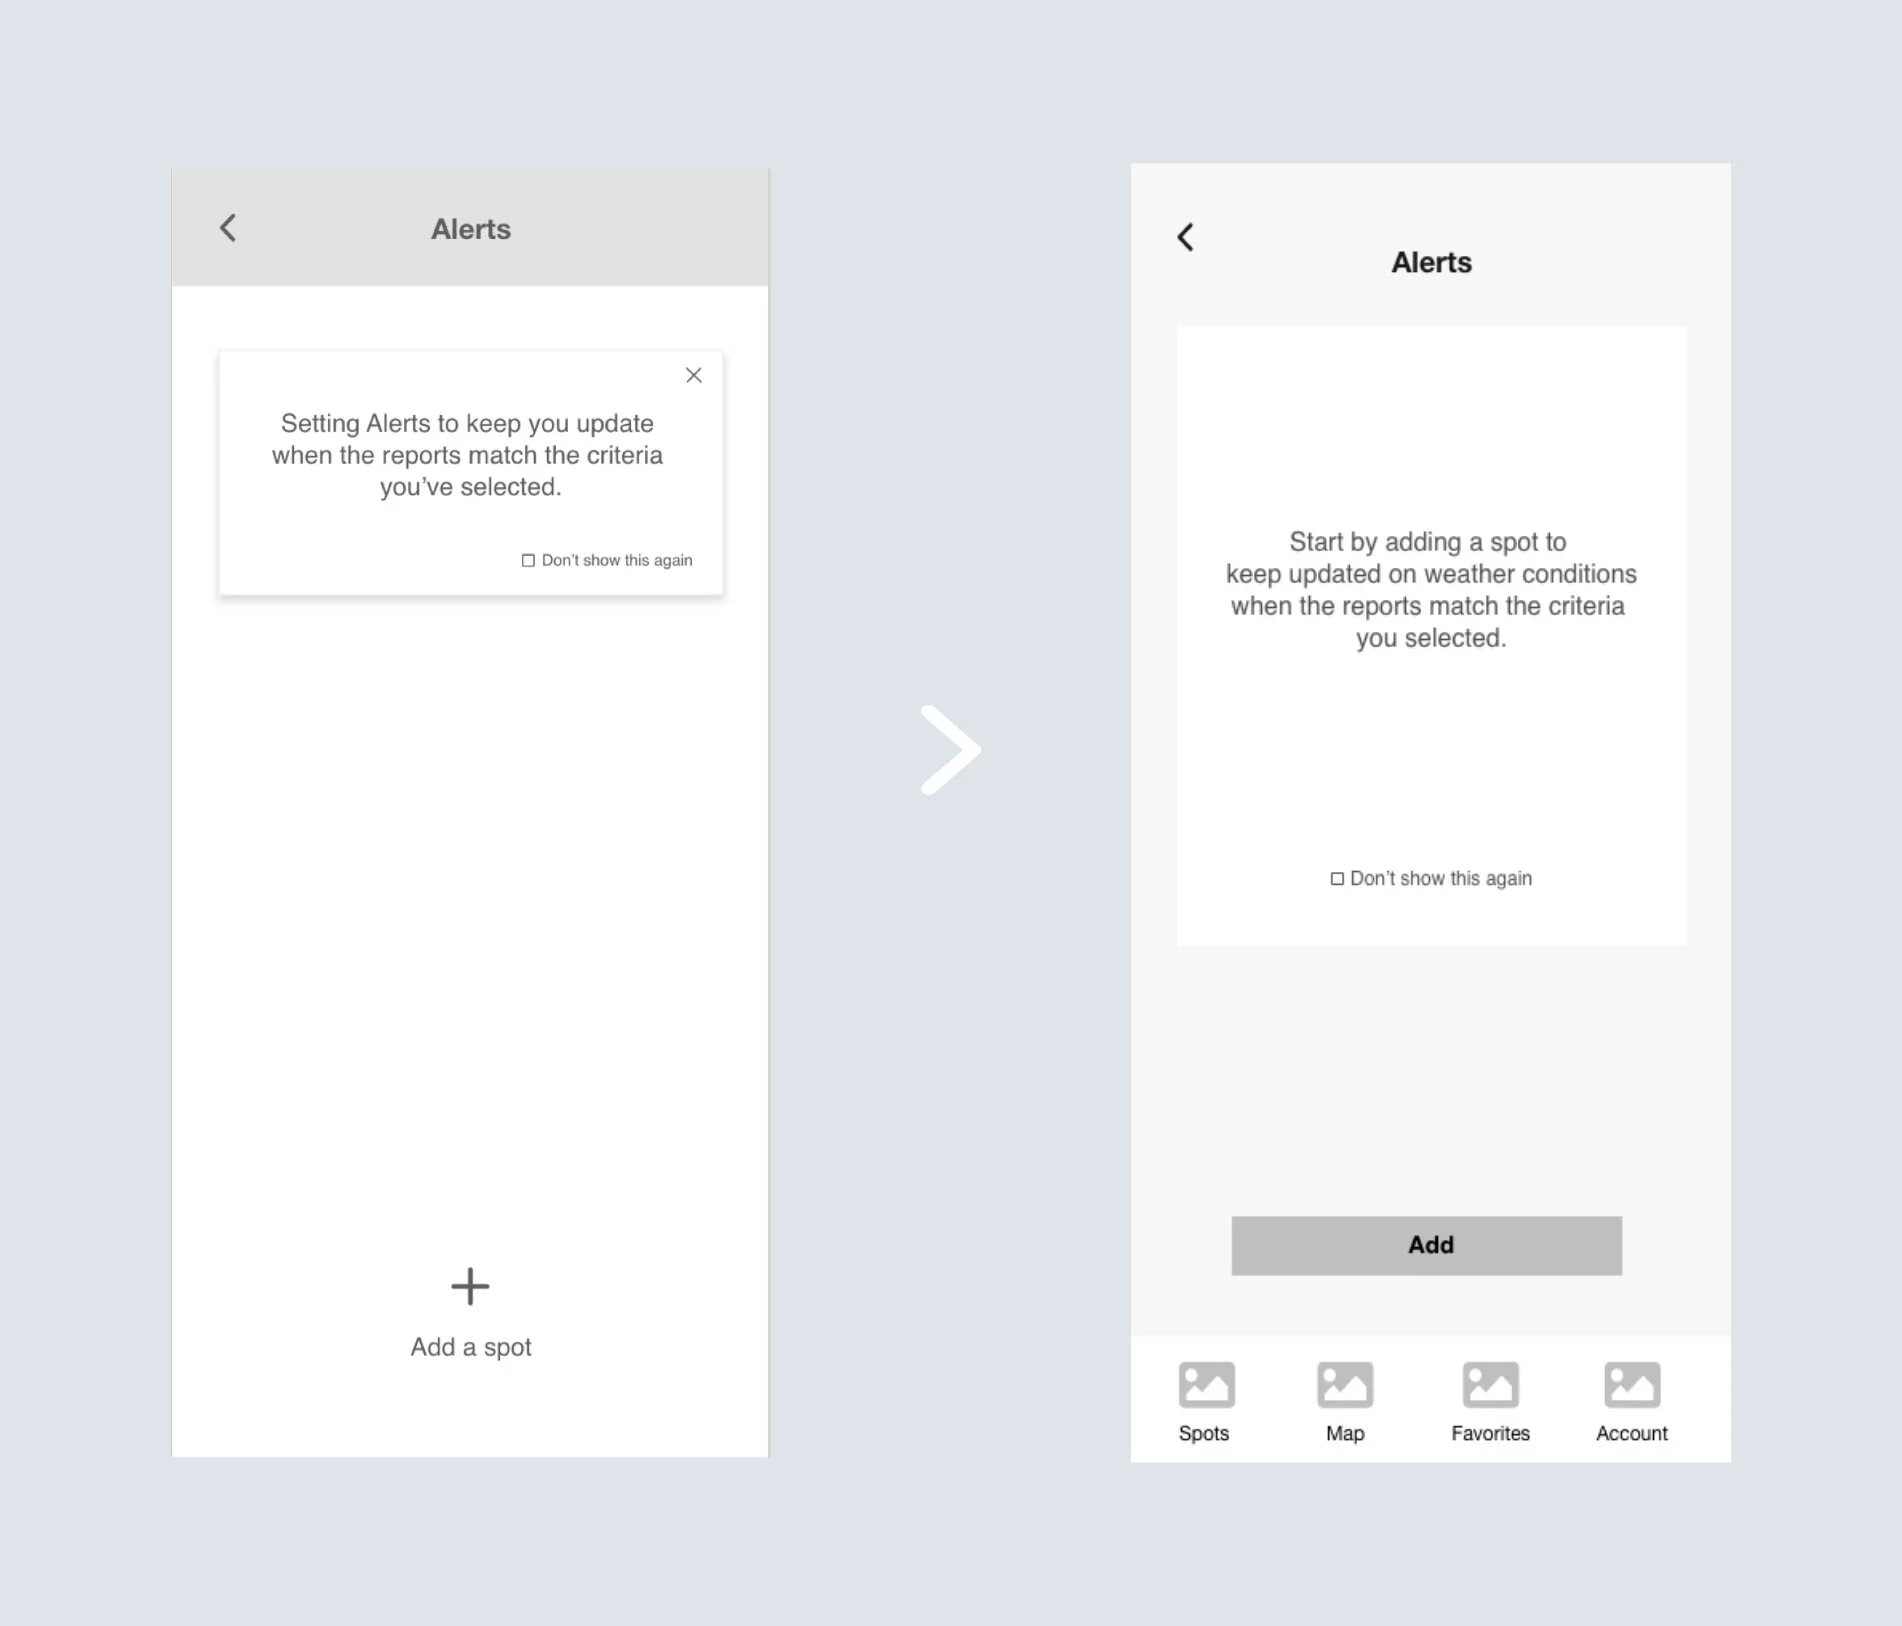
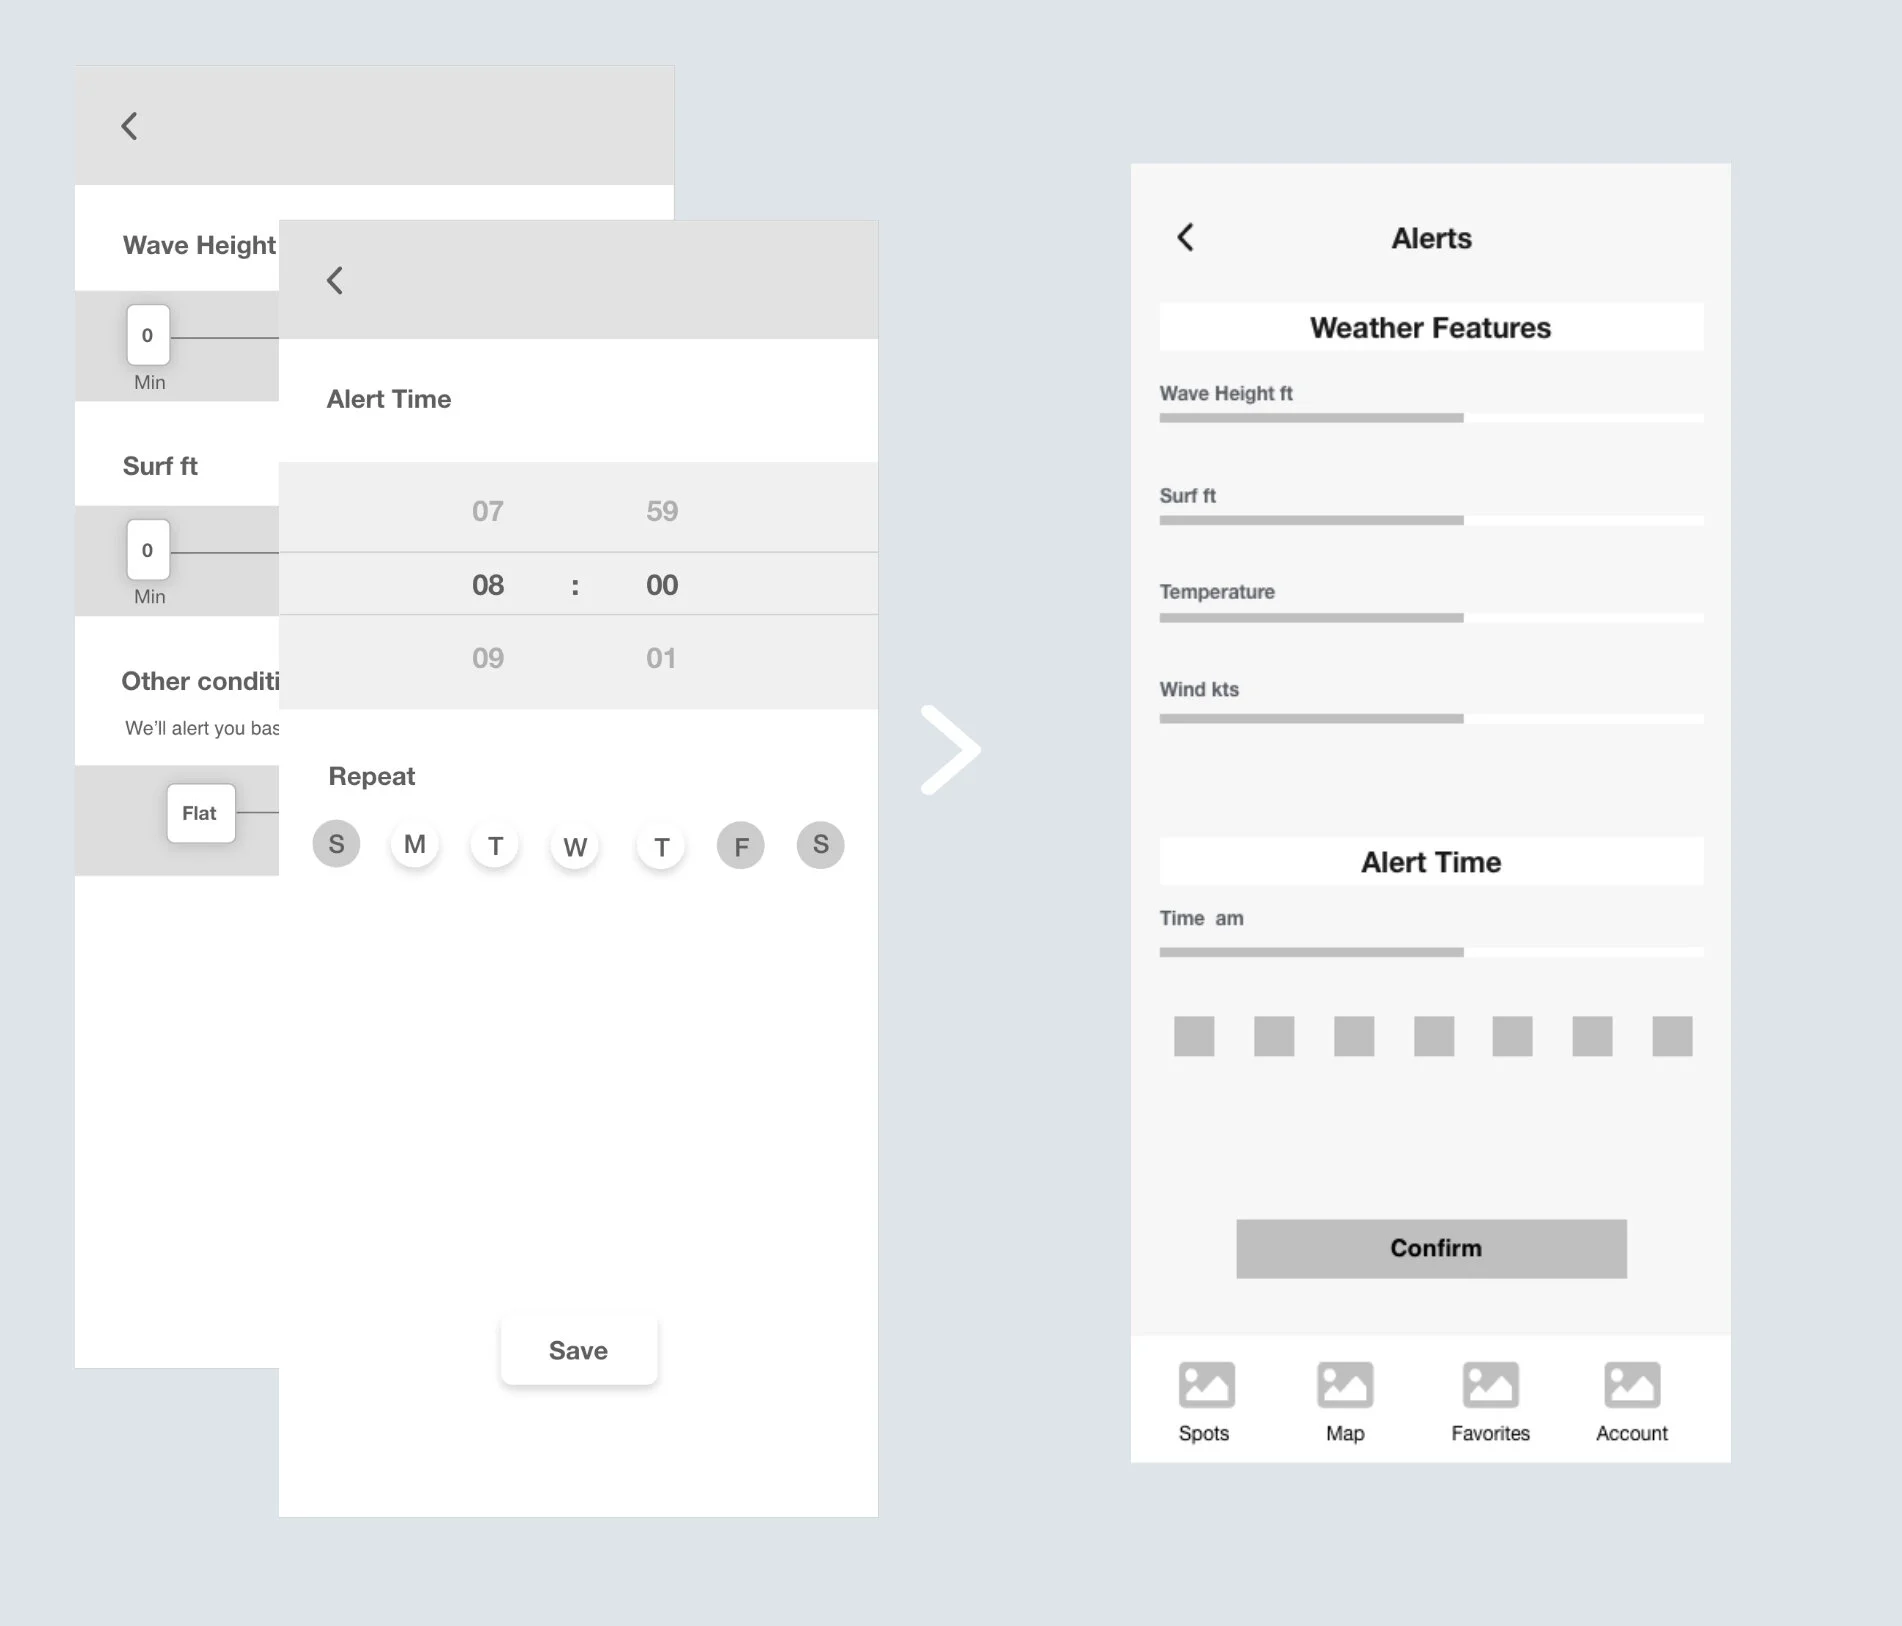
KEY FEATURE 4: Weather Alerts
Customizing weather features to receive timely notifications. Starting by choosing a location and set suitable criteria.
RESPONSIVE BREAKPOINTS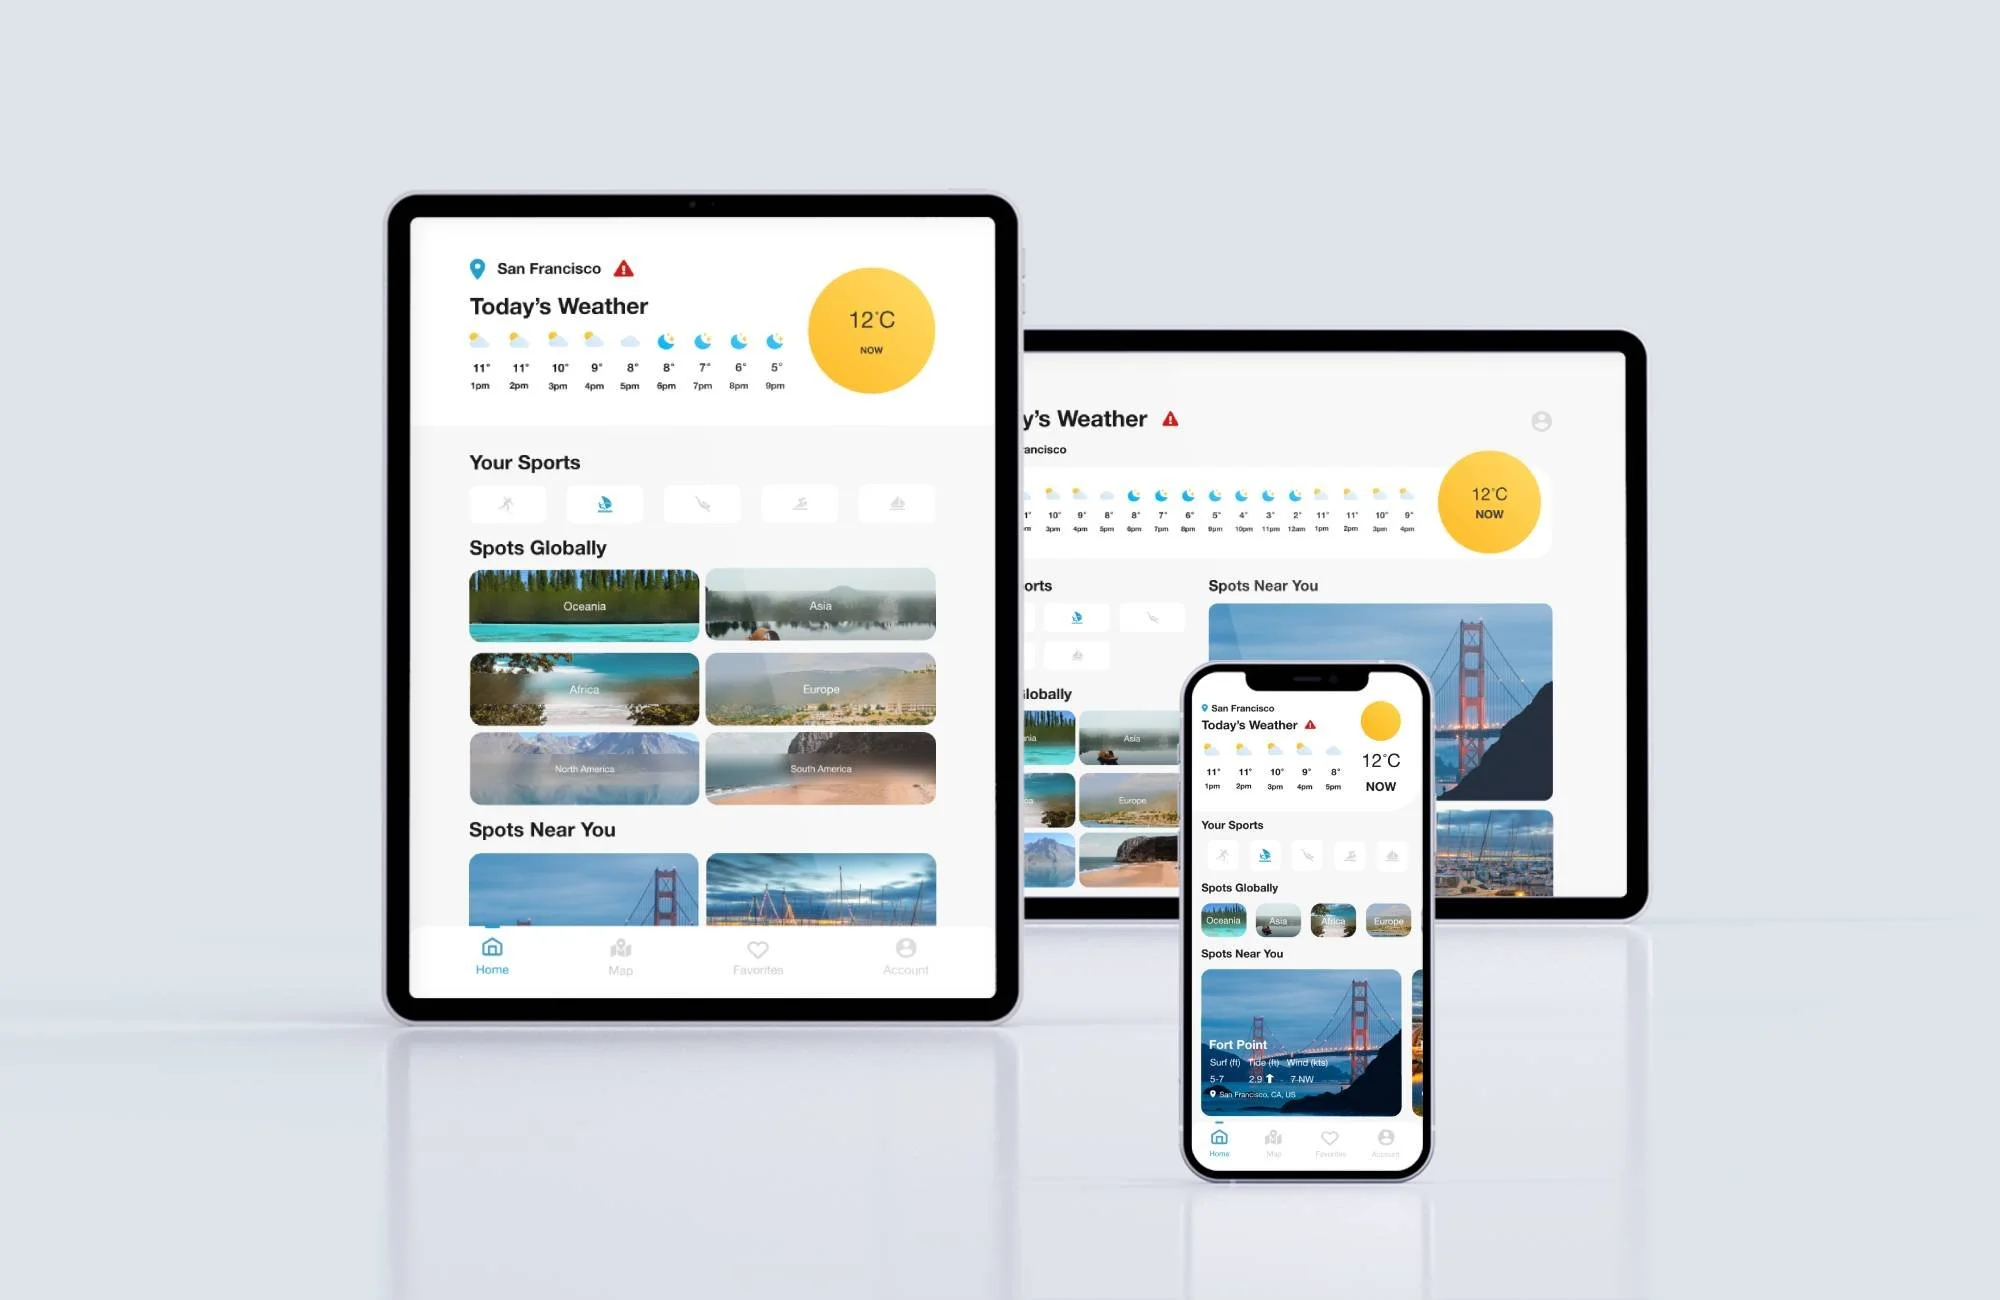
Taking a mobile-first approach to ensure the product is more readable on smaller screens. Adding a responsive breakpoint makes it more mobile-friendly on devices with large and small screens.

DISCOVER
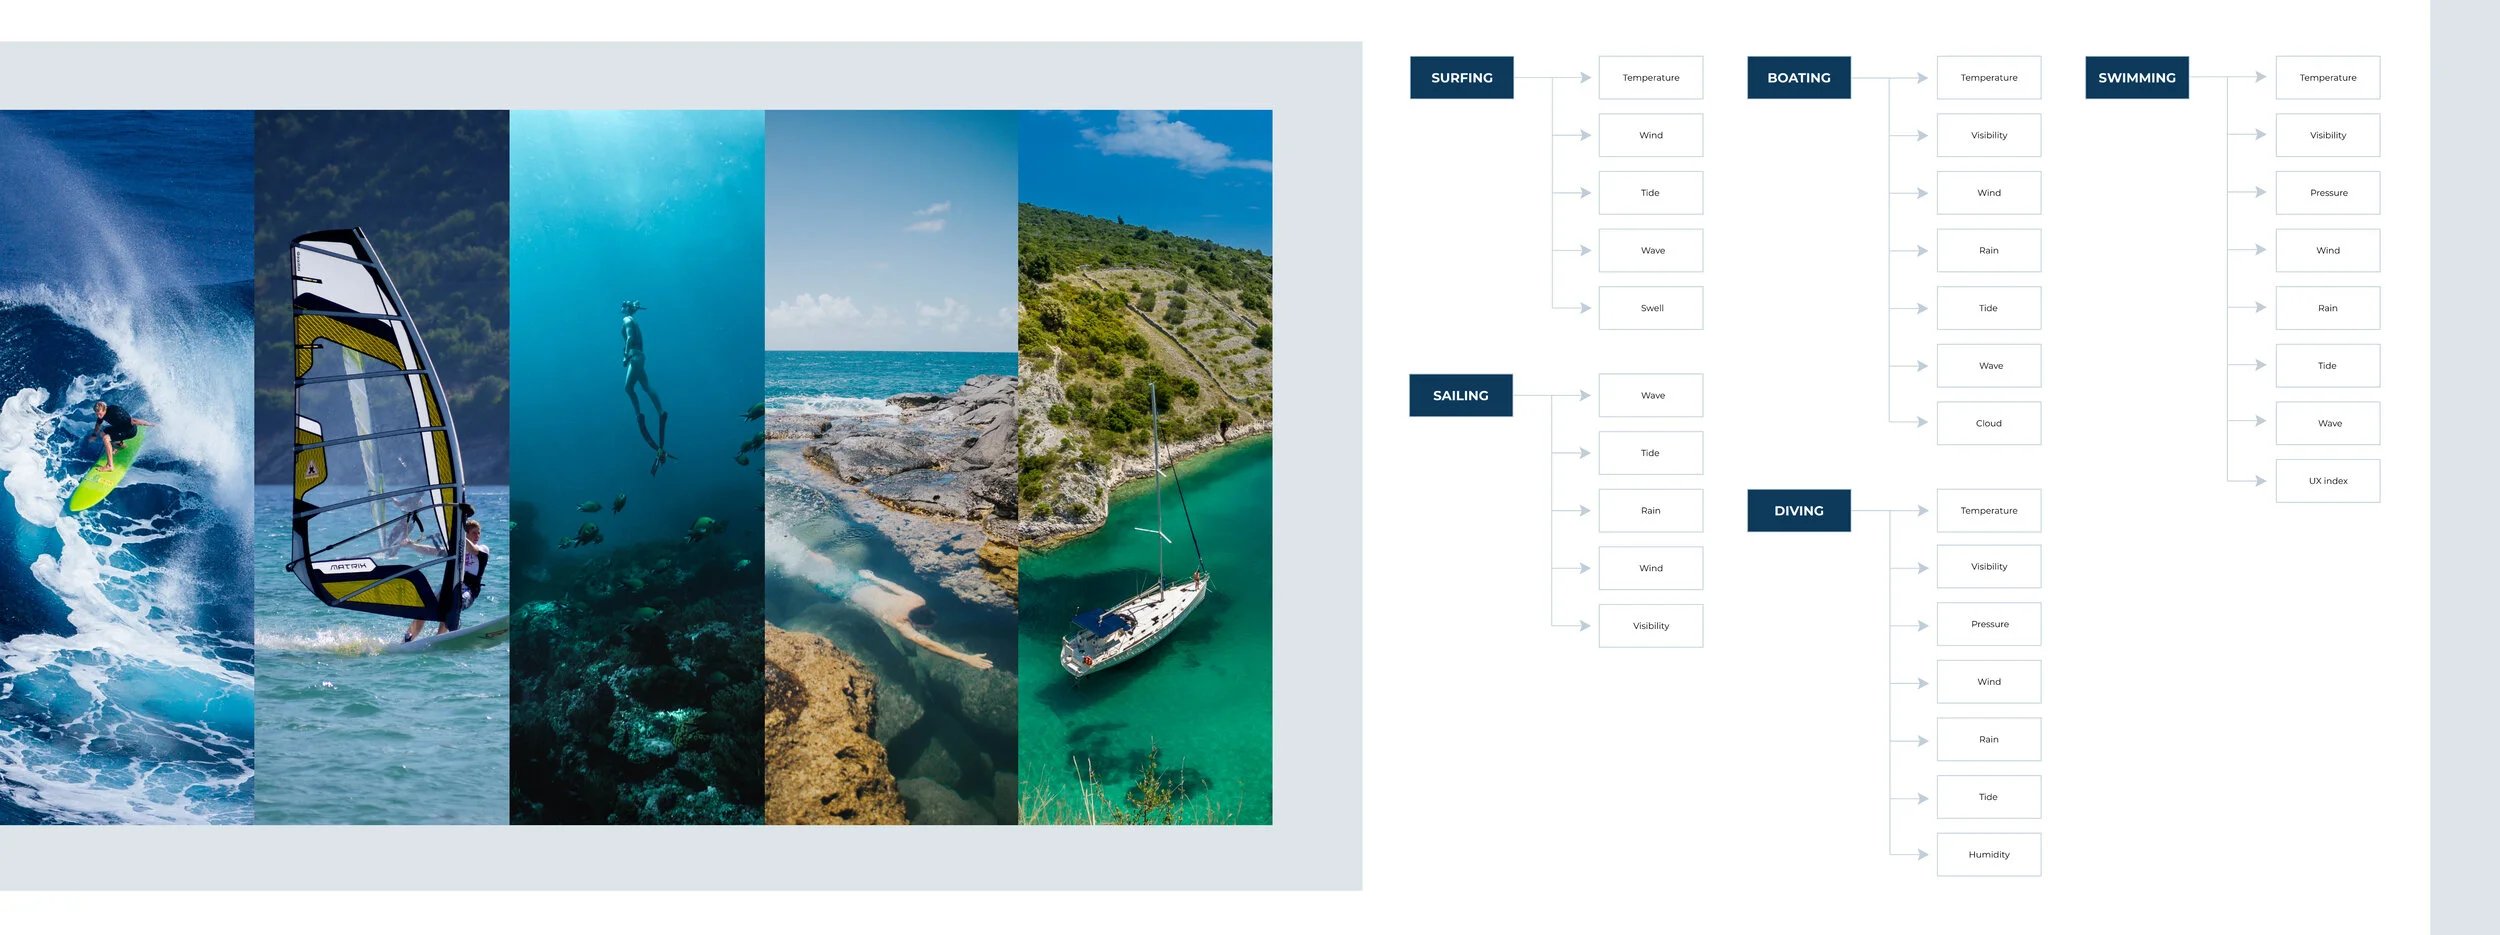
MARKET RESEARCHFrom the business perspective, I need to know my target audience and find out what is the most popular and liked water activity. Research indicates that most go to the sea for surfing, sailing, diving, swimming, and boating. Hence my primary focus will be on these activities. Both above and below water activities will always depend heavily on weather conditions. Although the weather could not be simply defined as ‘good’ or ‘bad,’ we could review some different weather elements for each sport to find out what information is necessary to display. Therefore, I grouped different weather elements into each field, which affects the direction of the questions later on in the project survey.
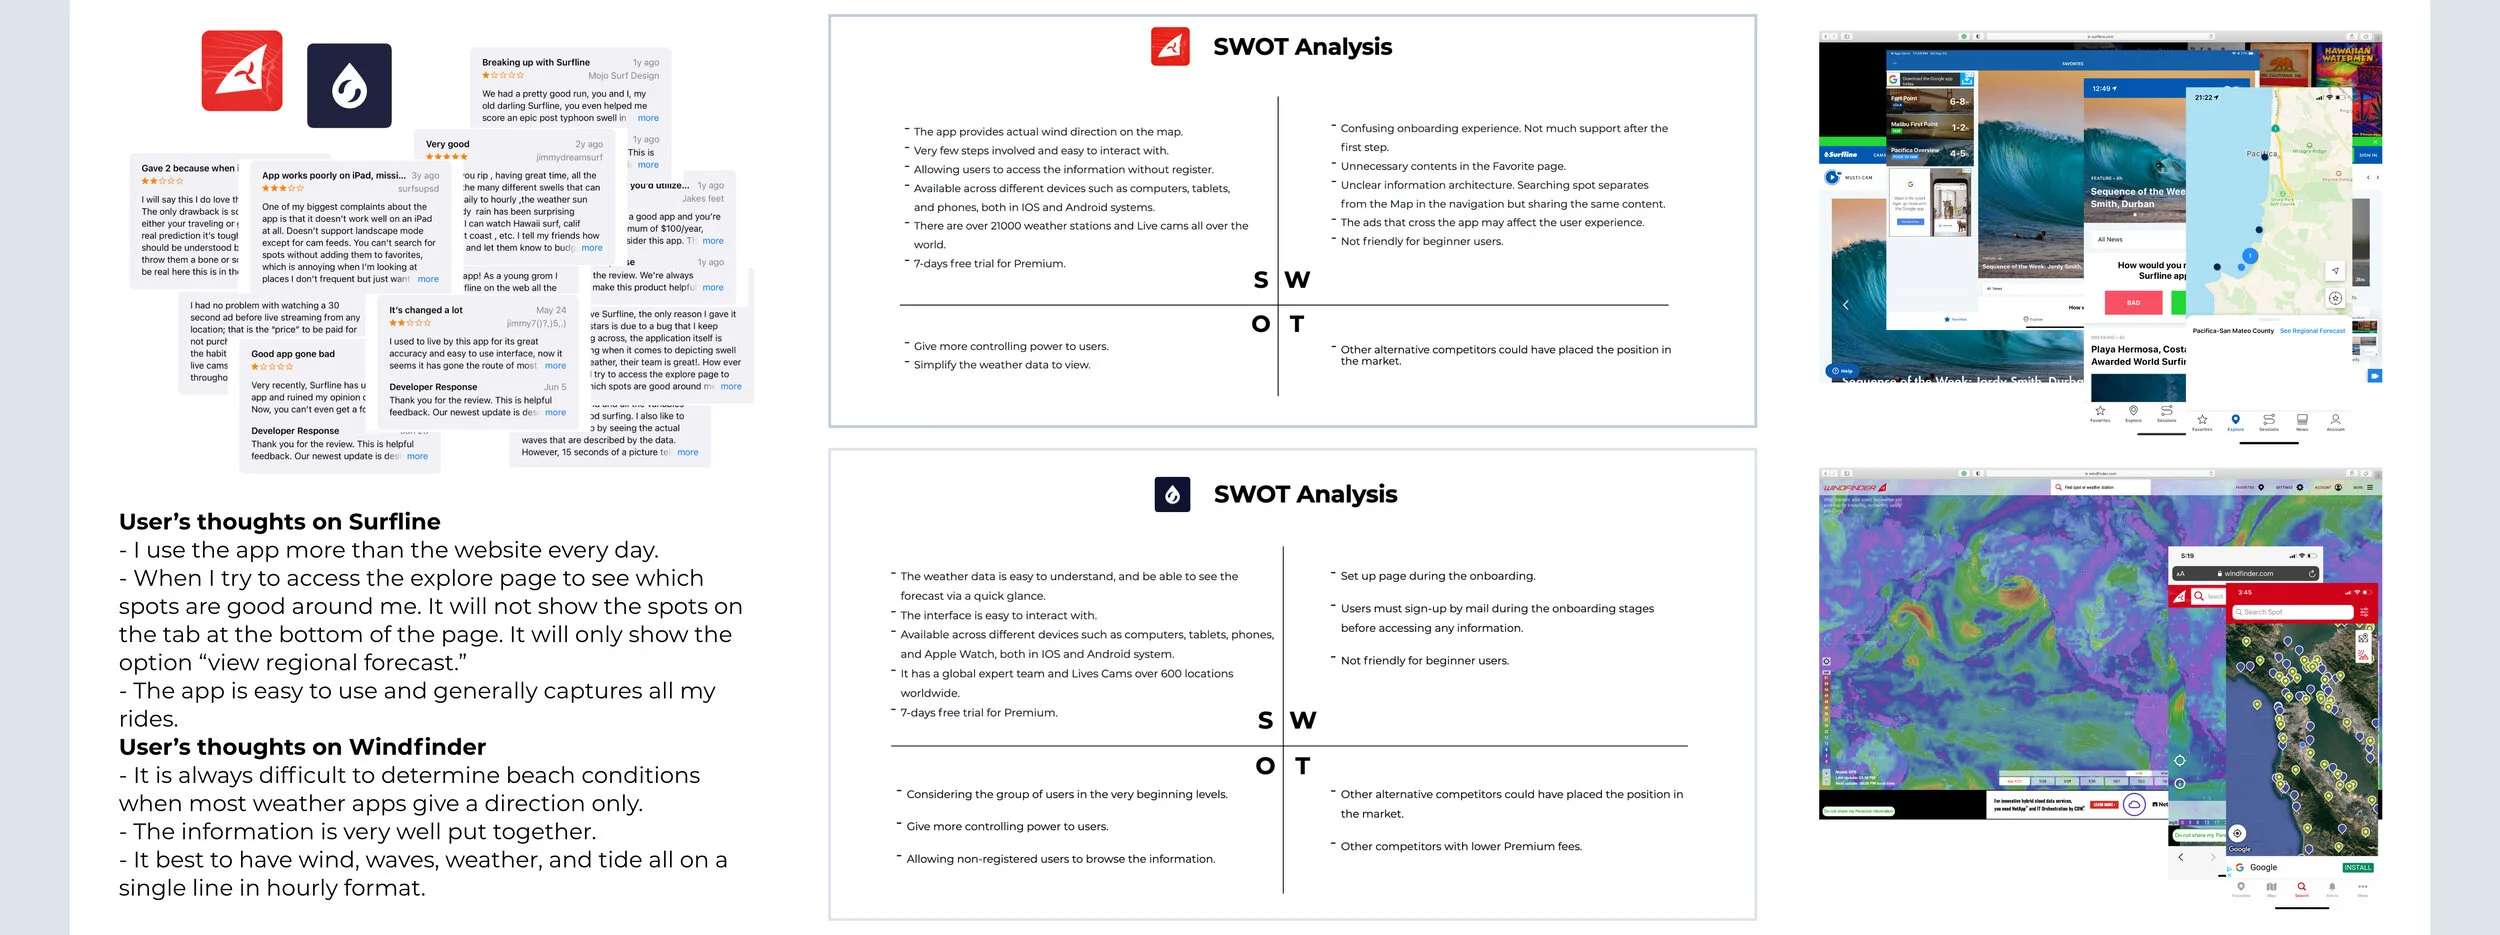
IDENTIFY OPPORTUNITIESMoving to the competitive analysis, I researched the popularity of wind and weather forecasts app in the market. I conducted a SWOT analysis to identify other product’s strengths and weaknesses. Reducing the chances of a useless product and catching my opportunities.
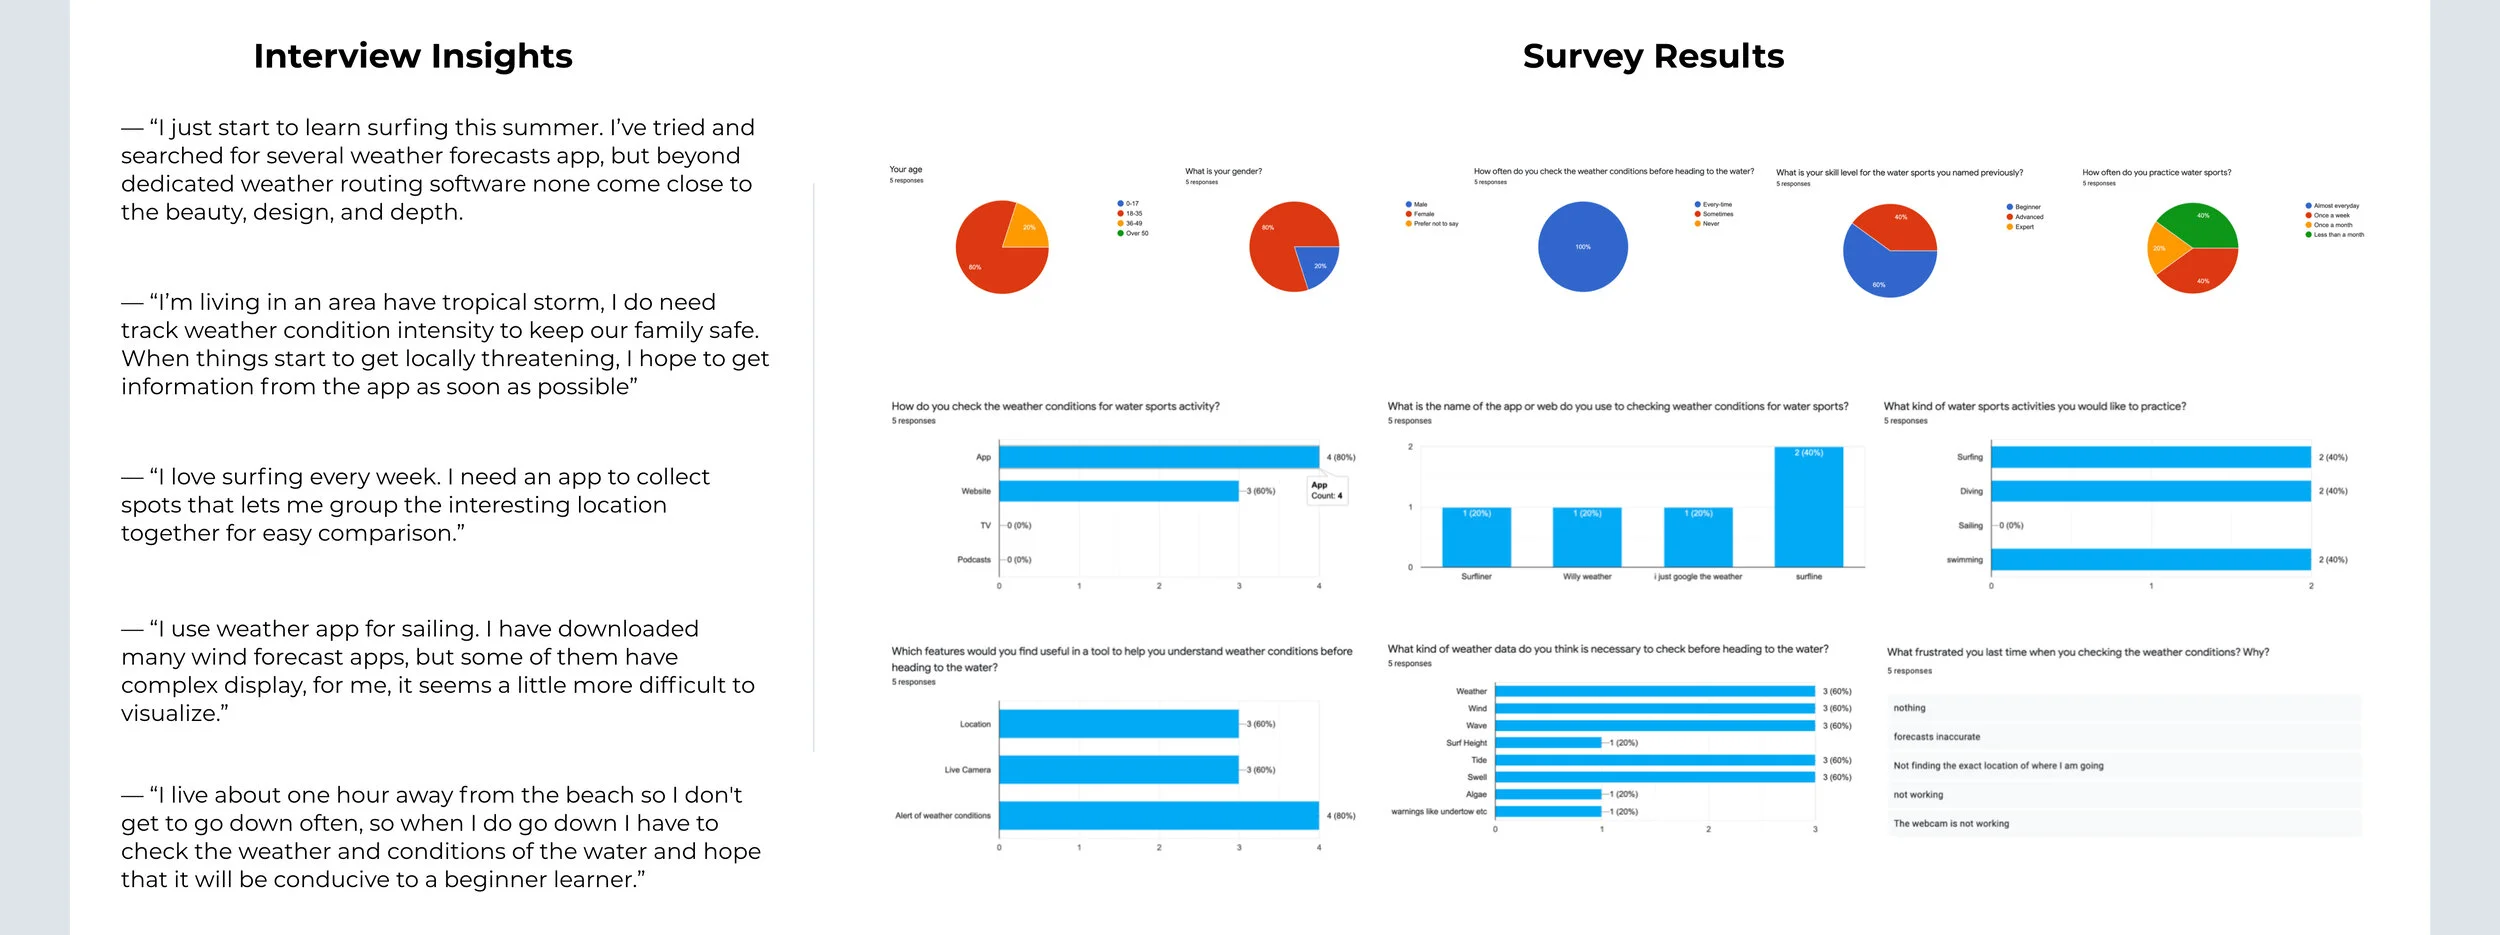
USER RESEARCHI conducted user research to get early insights from the field. I’ve interviewed many participants to learn their needs and pain points. After talking with participants, I began to think how many people would have the same frustrations and wonder if there is any bias with the answers. So, I surveyed a larger participant group to understand the true challenges they experienced.
AFFINITY MAPPINGAfter all the researches were done with users, I applied an affinity mapping approach to organizing opinions from cluttered to sorted into groups based on their needs, behaviors&attitudes, habits, and frustration.
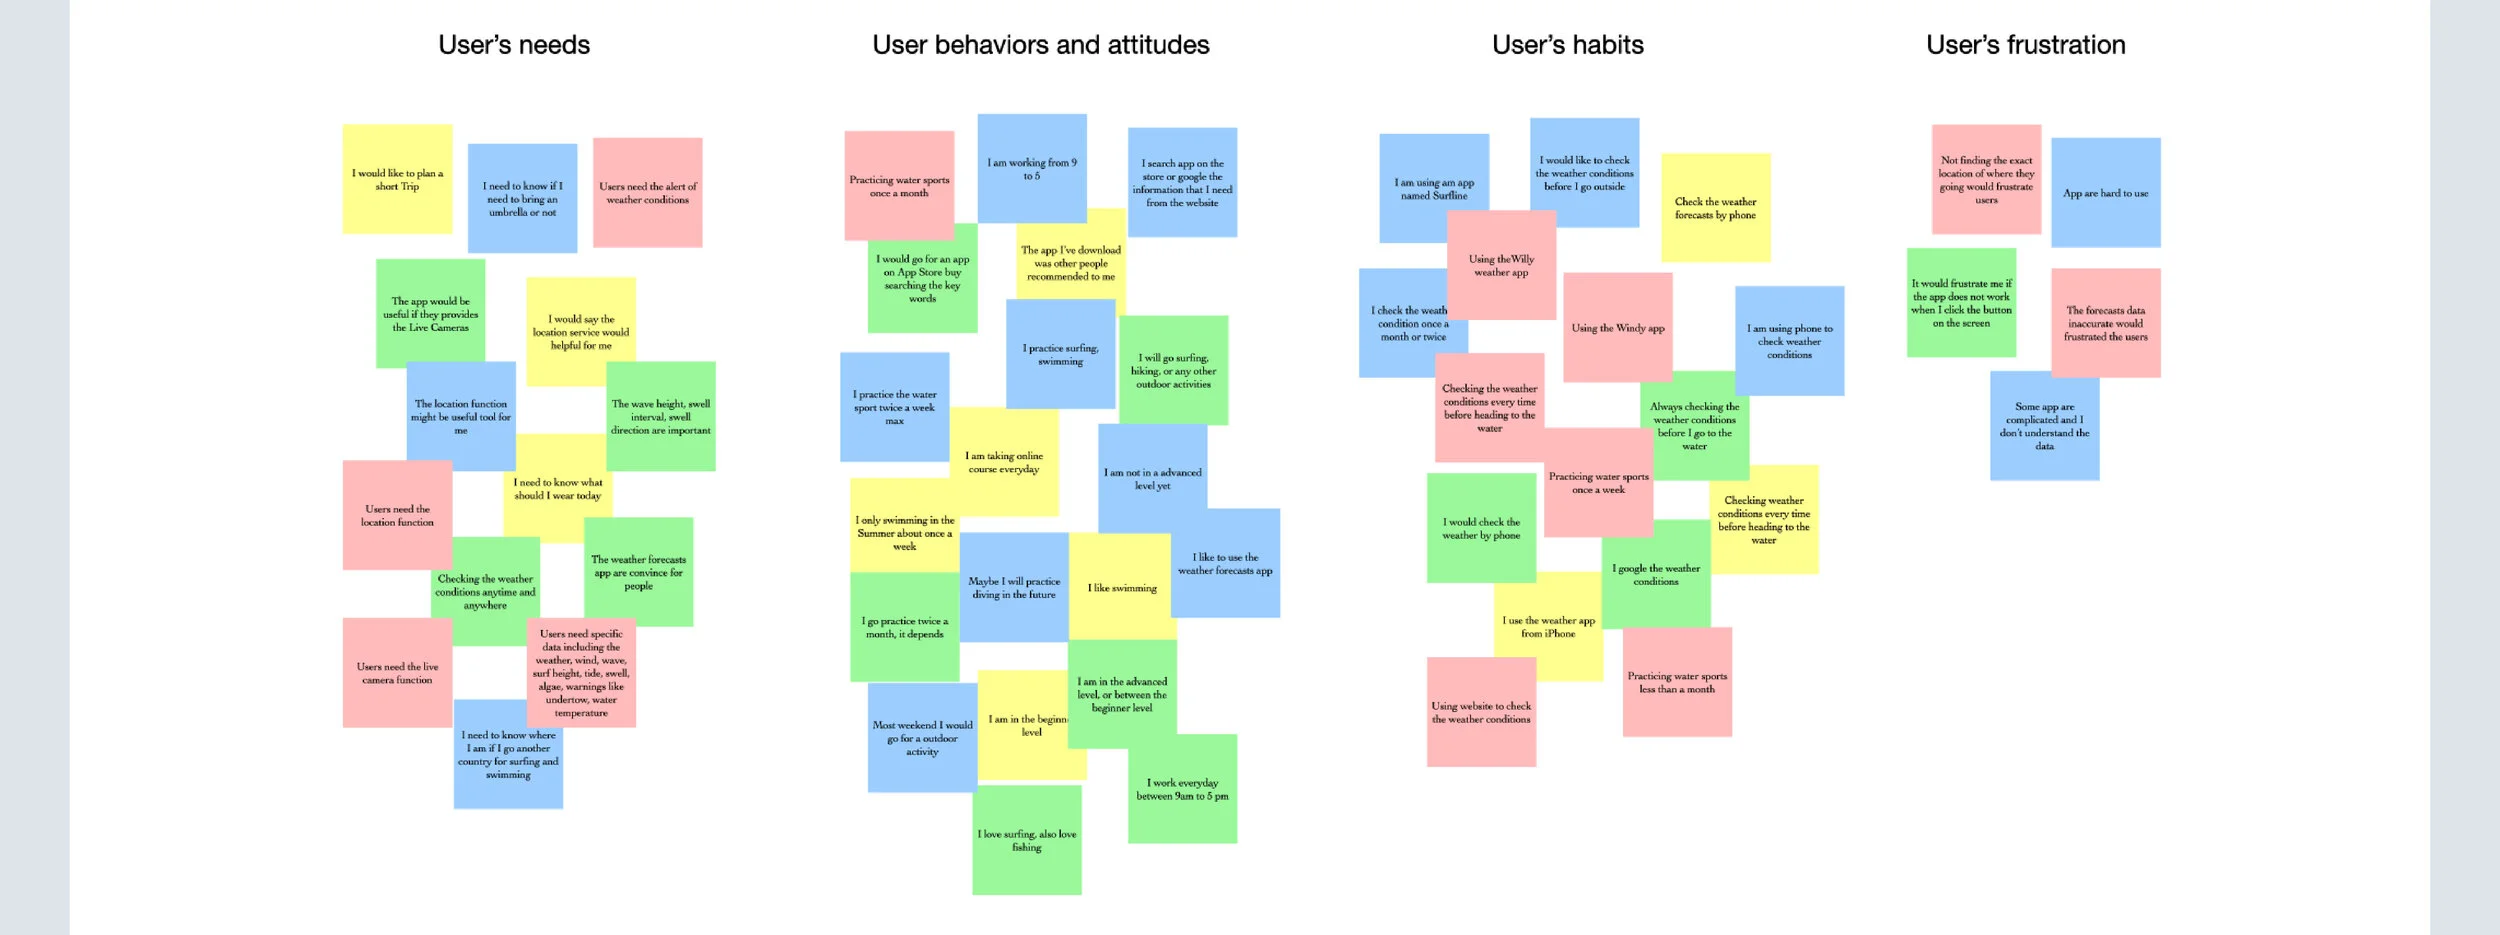
FINDING & OPPORTUNITIESThe target audience is water sports lovers with different skill levels. The primary concerns are complexity, availability, timeliness, and aesthetics of weather products.
Whether looking for big waves, barrels, or beginner breaks, locating a suitable water spot is a tricky thing. It’s hard to find a place where the point and reef breaks are friendly enough that makes them feel safe and comfortable.
For the traditional weather forecasting map, it is hard for users to identify a satellite image to get a briefing from the forecasting.
It's often becoming a challenge for users to accessing weather reports, as it requires observing and processing the massive complexities of weather data.
Some weather app not only inaccurate but also untimely when providing weather updates.

IDEATE
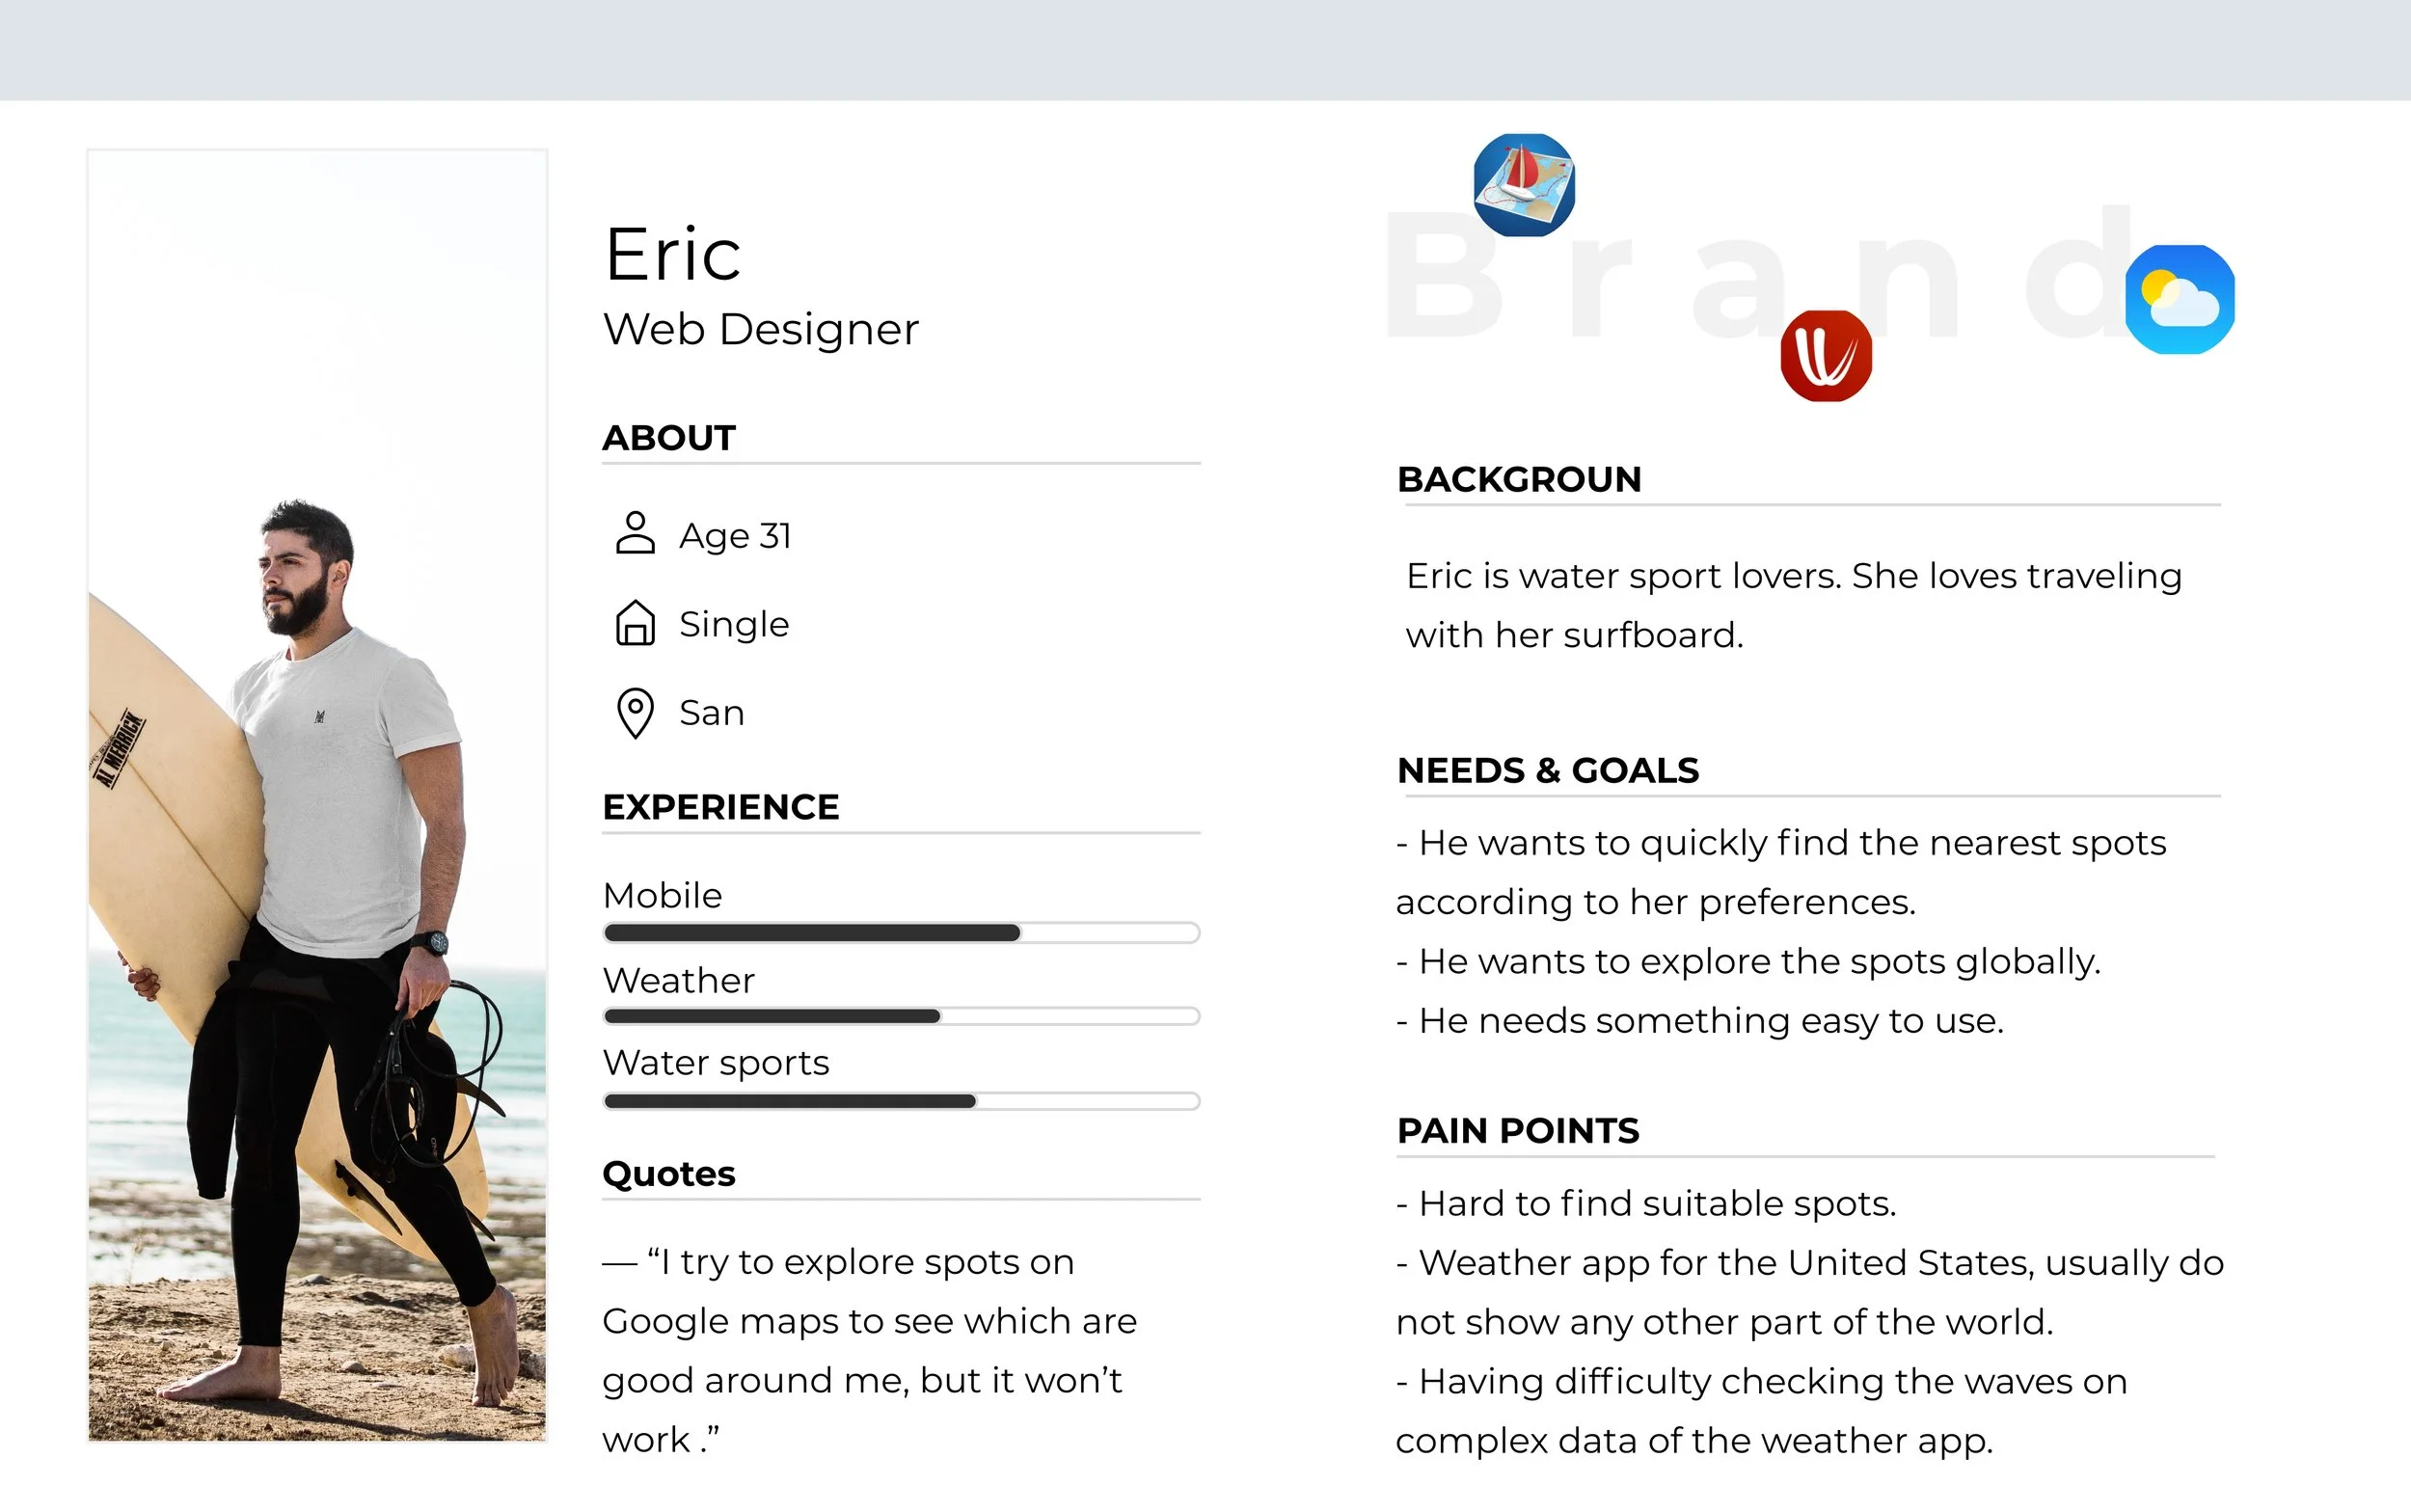
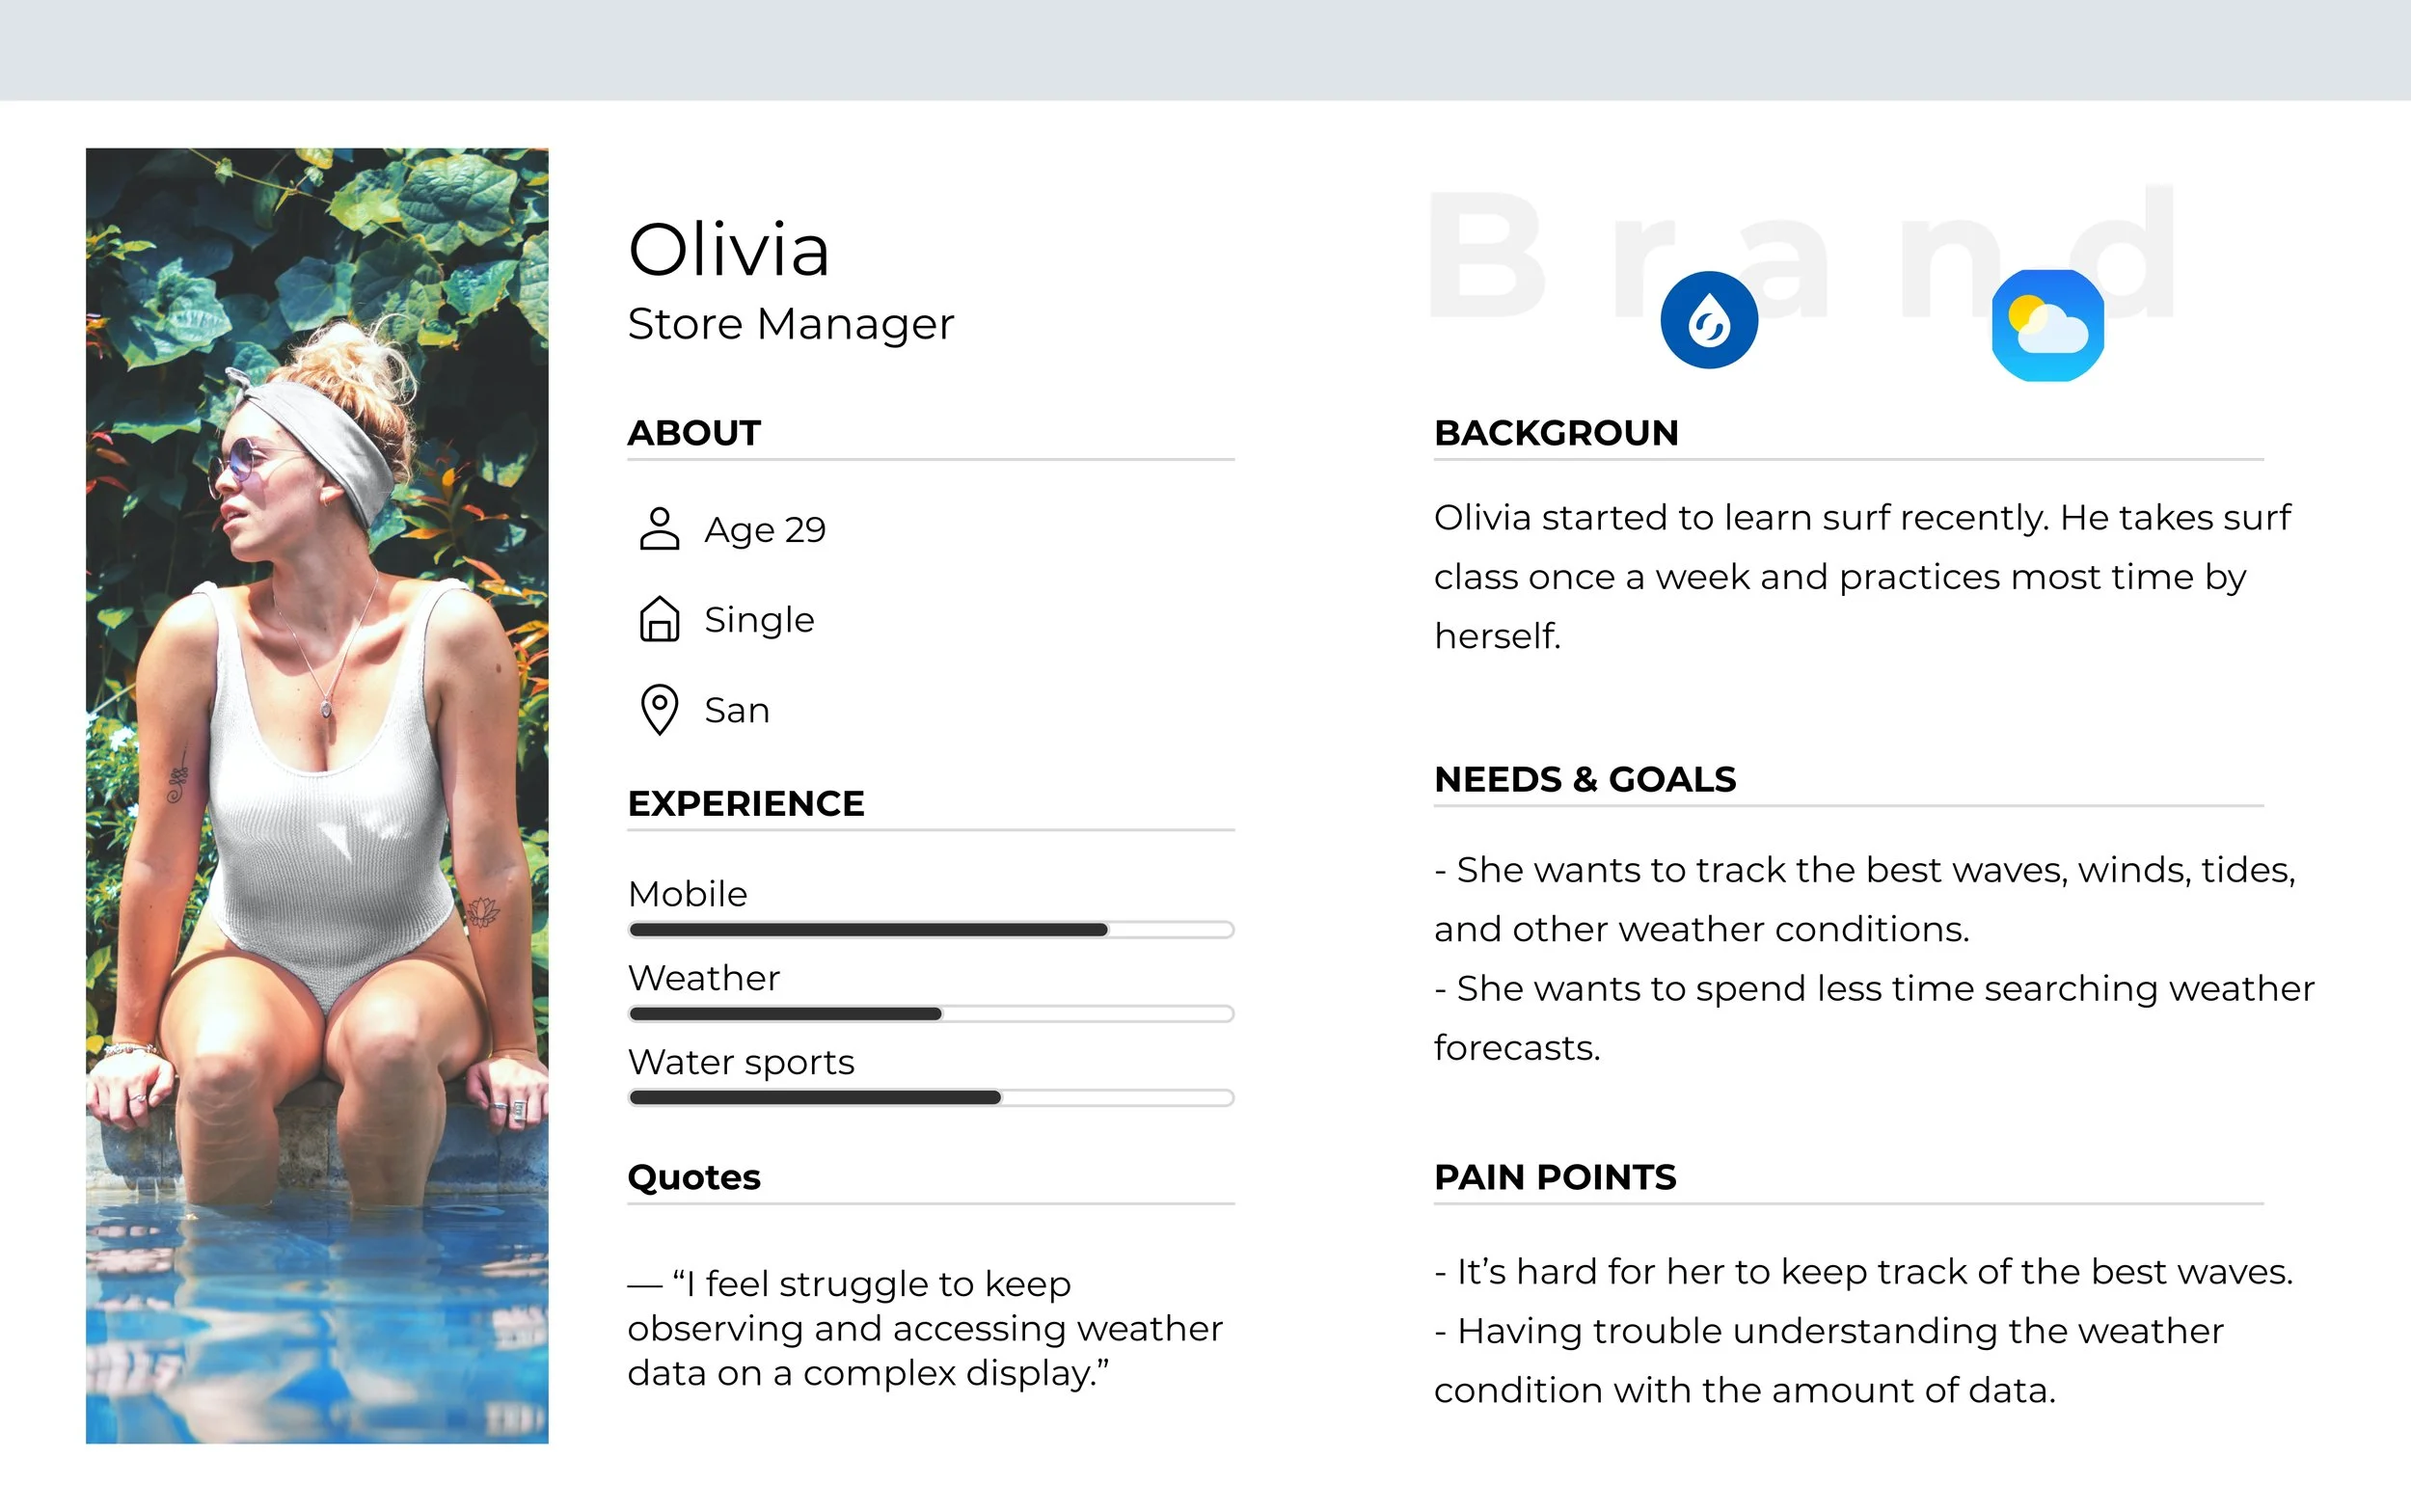
USER PERSONASTo identify who I'm designing for, I created user personas to help understand users’ needs, pain points, behaviors, and goals.
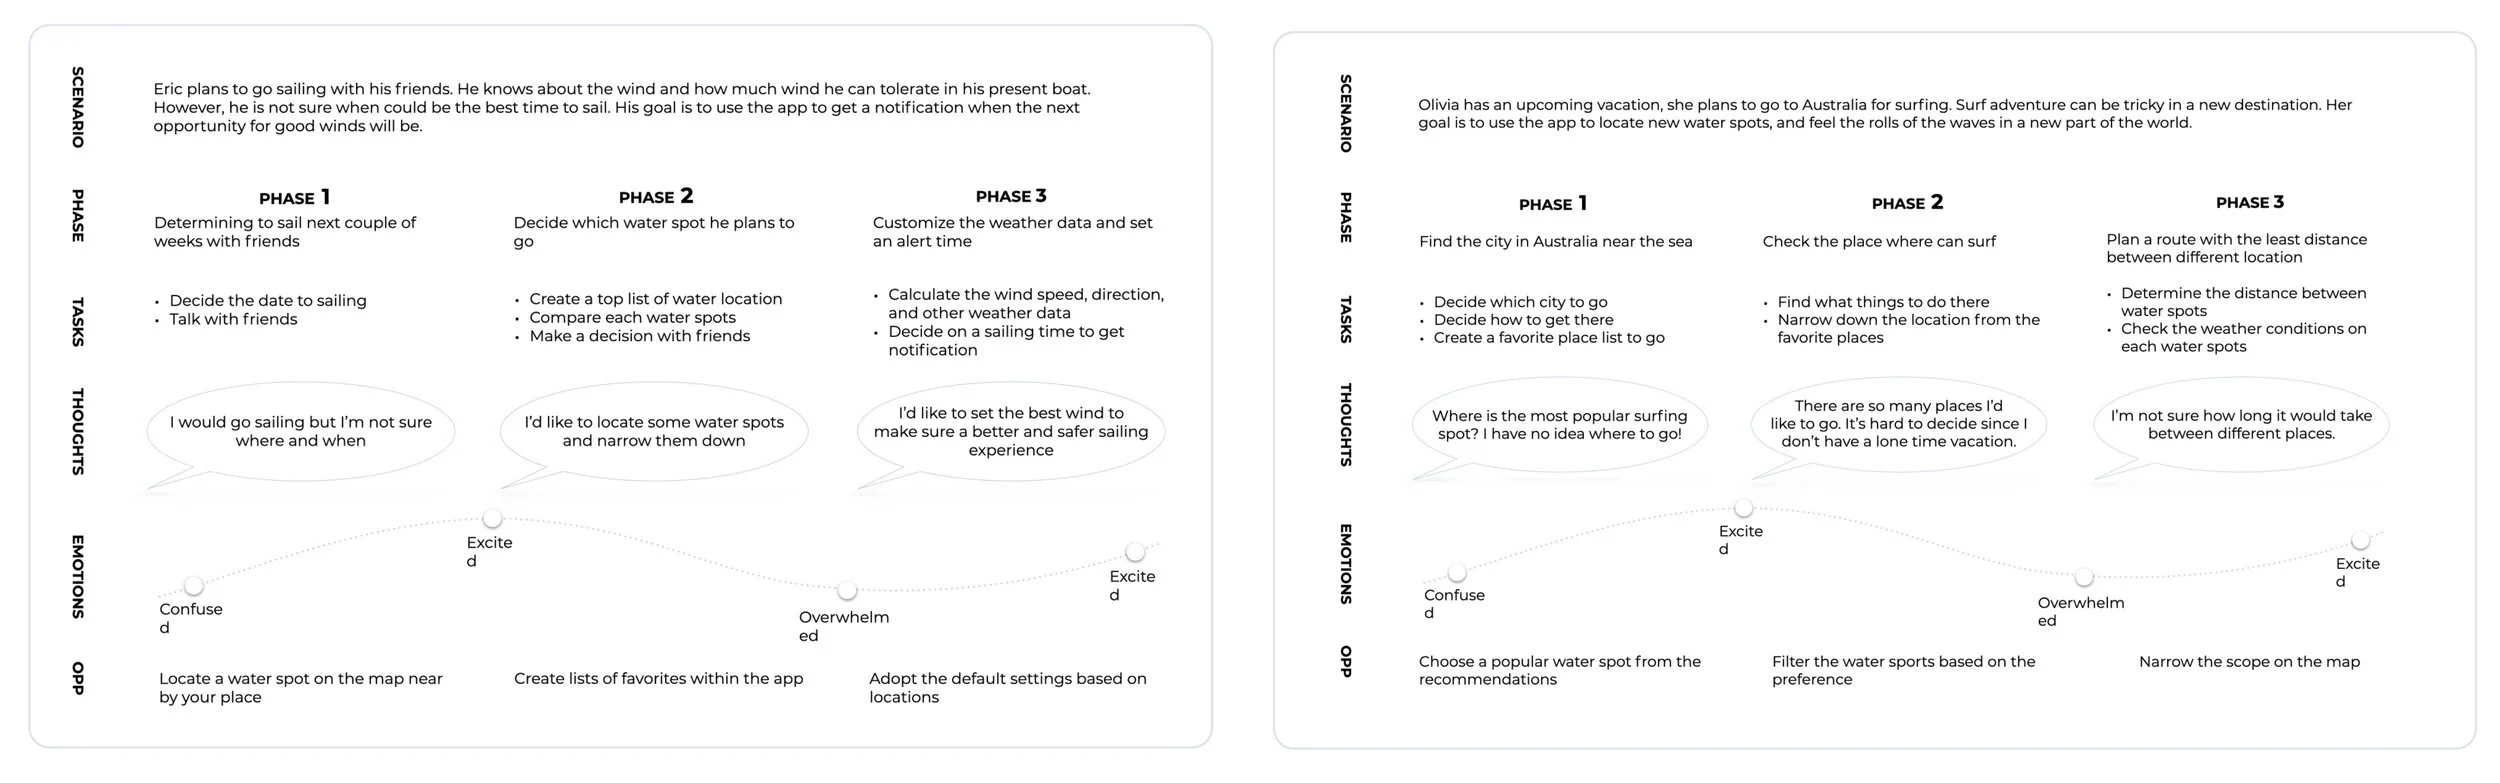
USER JOURNEYSTo make sure achieved users goals and helped with their frustrations. I created the user journeys that fill in how users discover the product and how they are using it to locate a spot and find the weather reports.
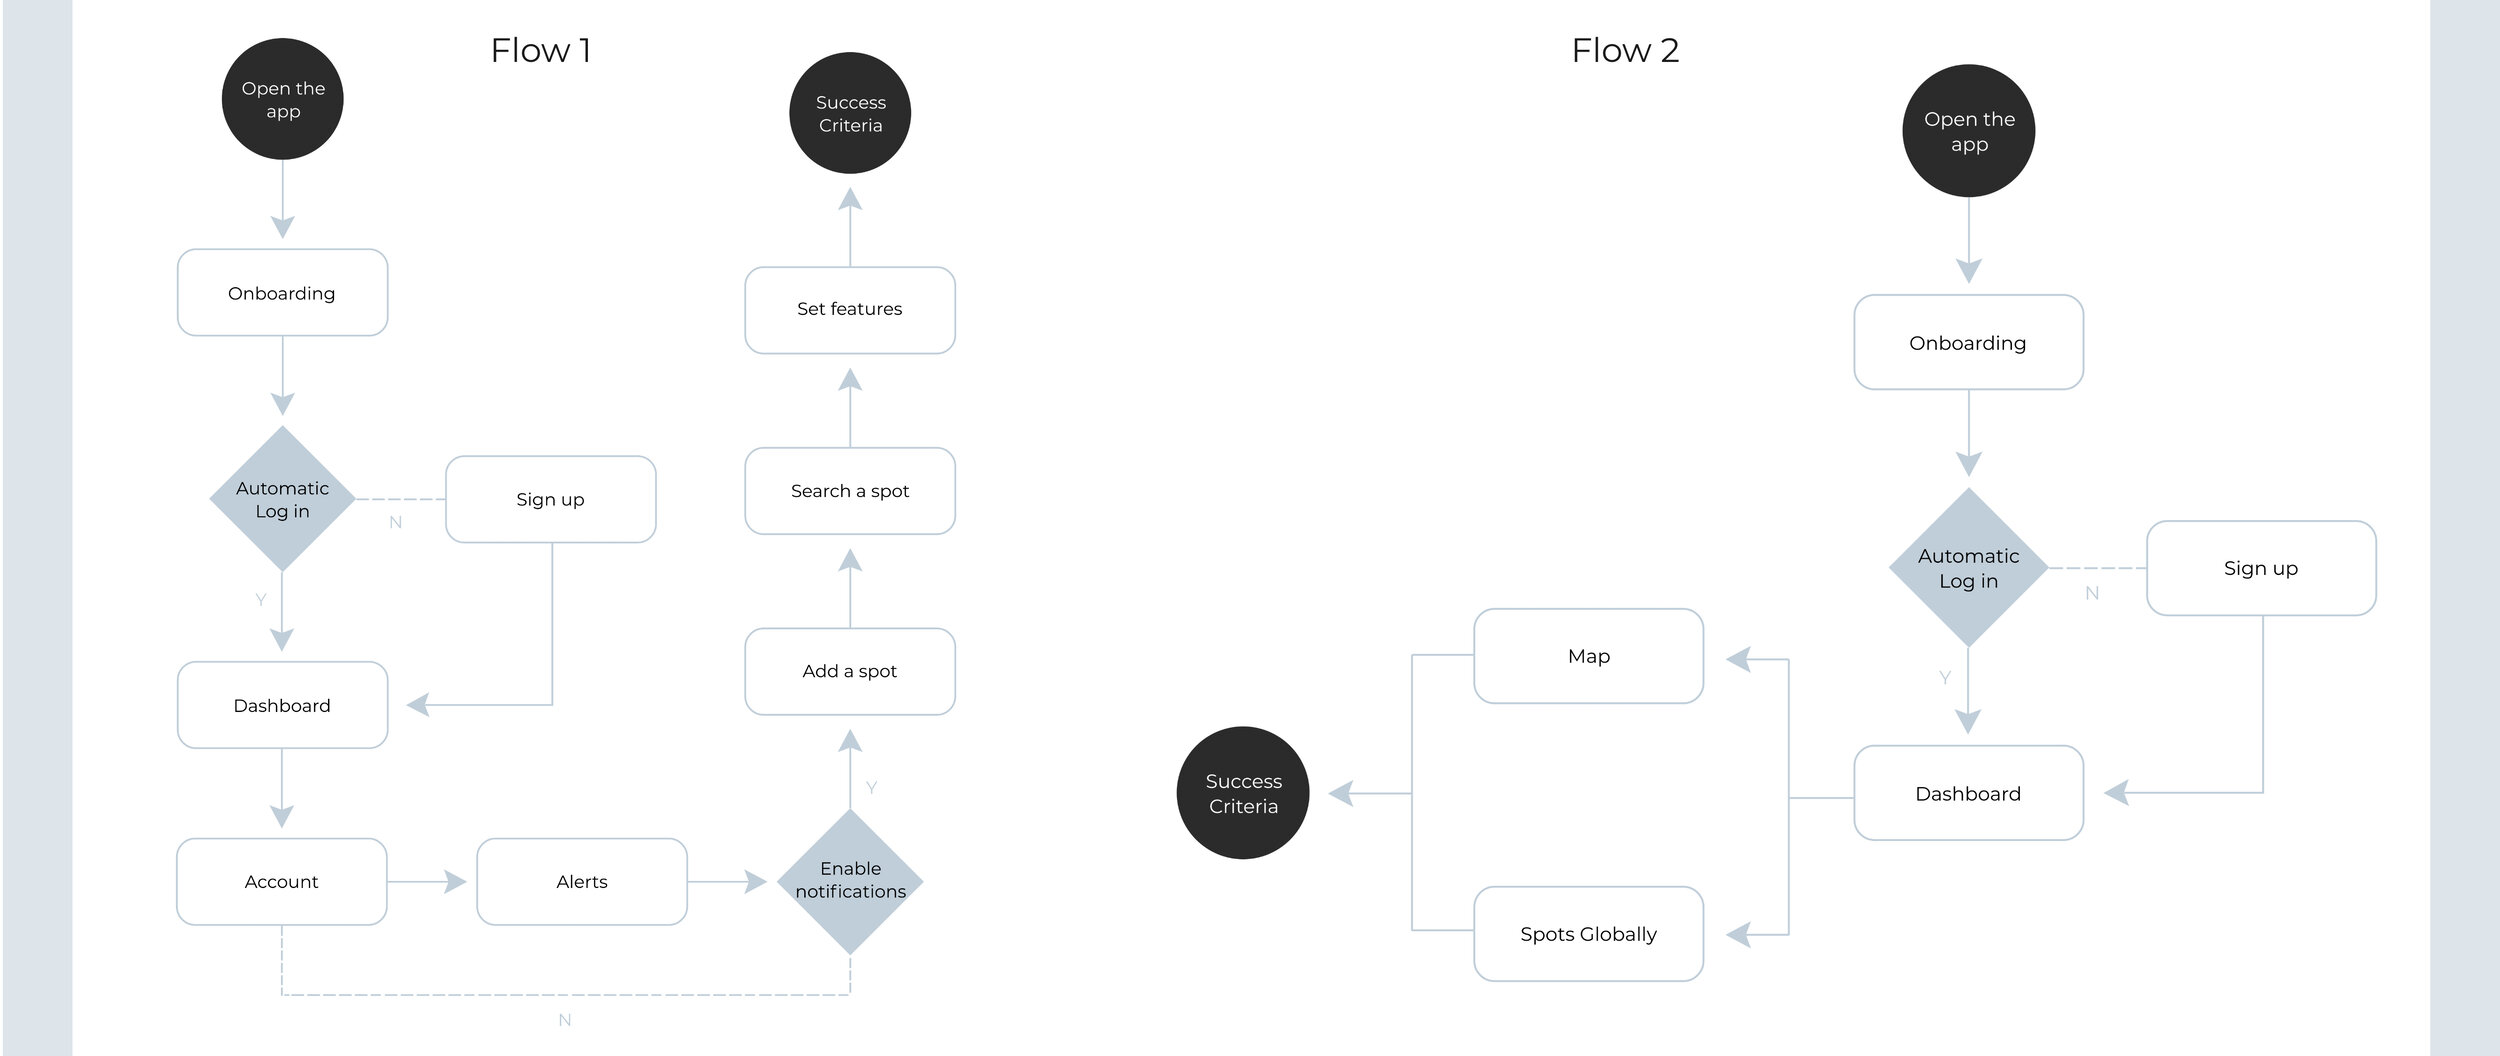
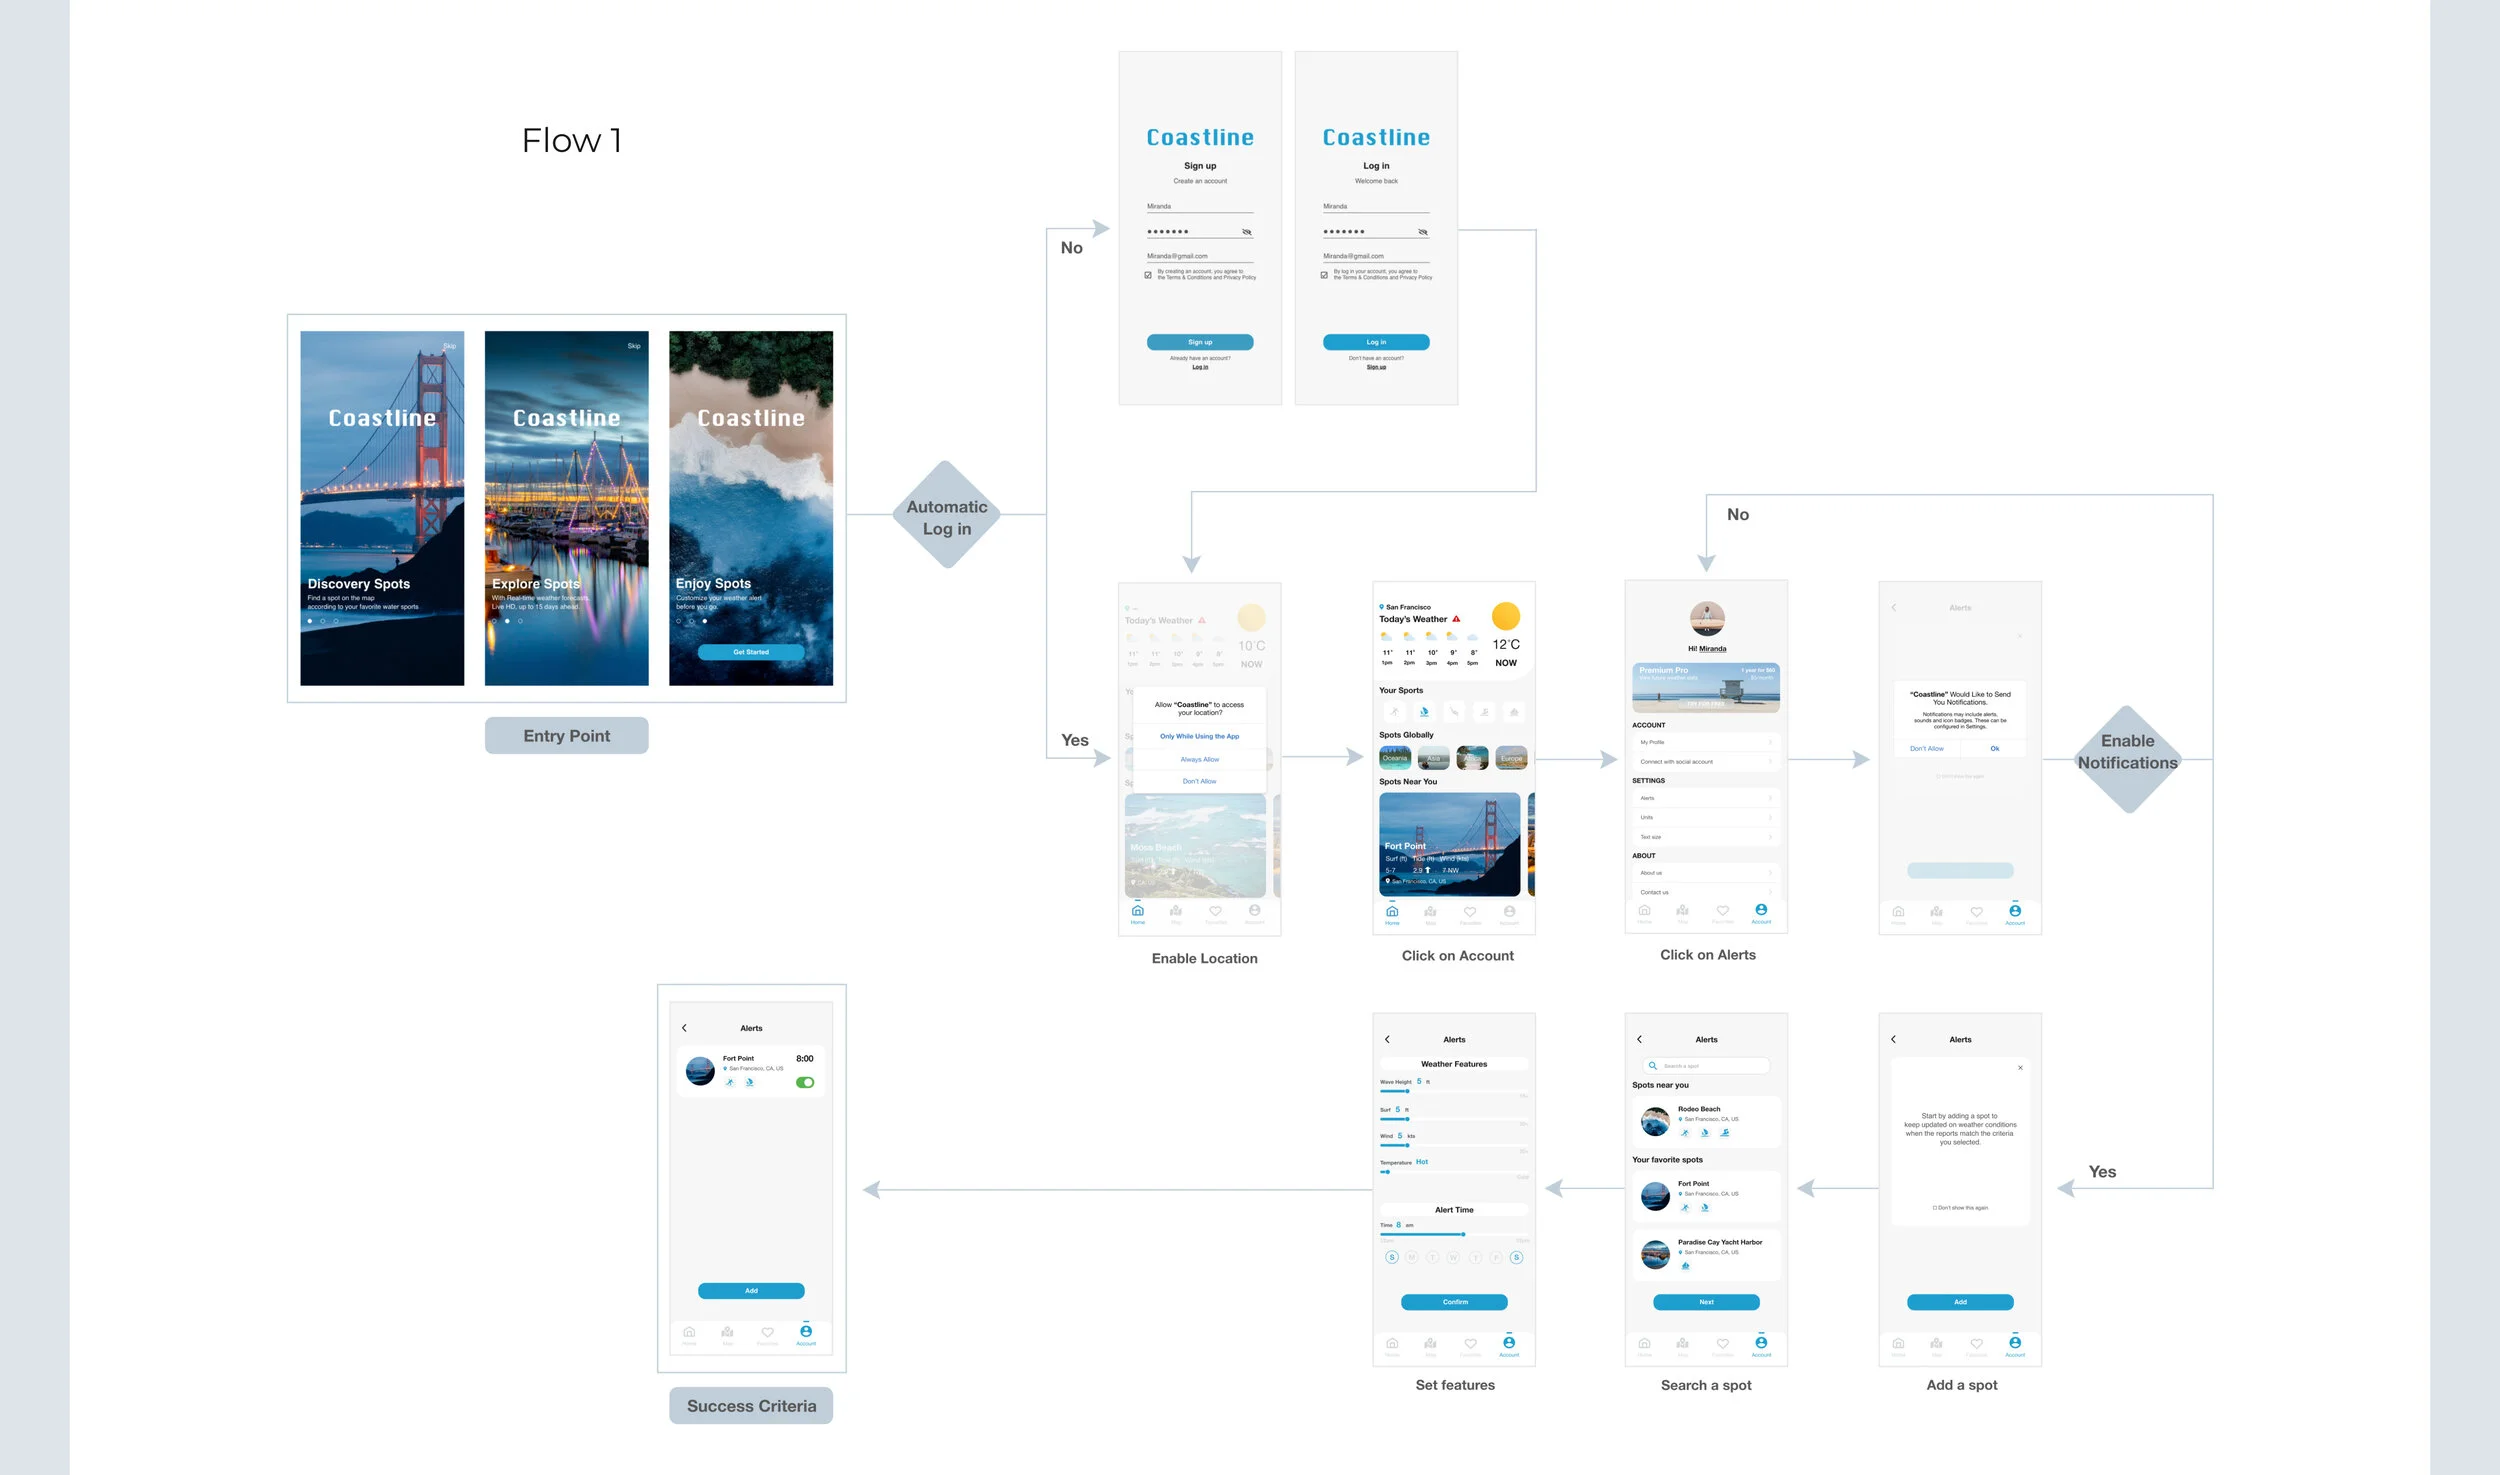
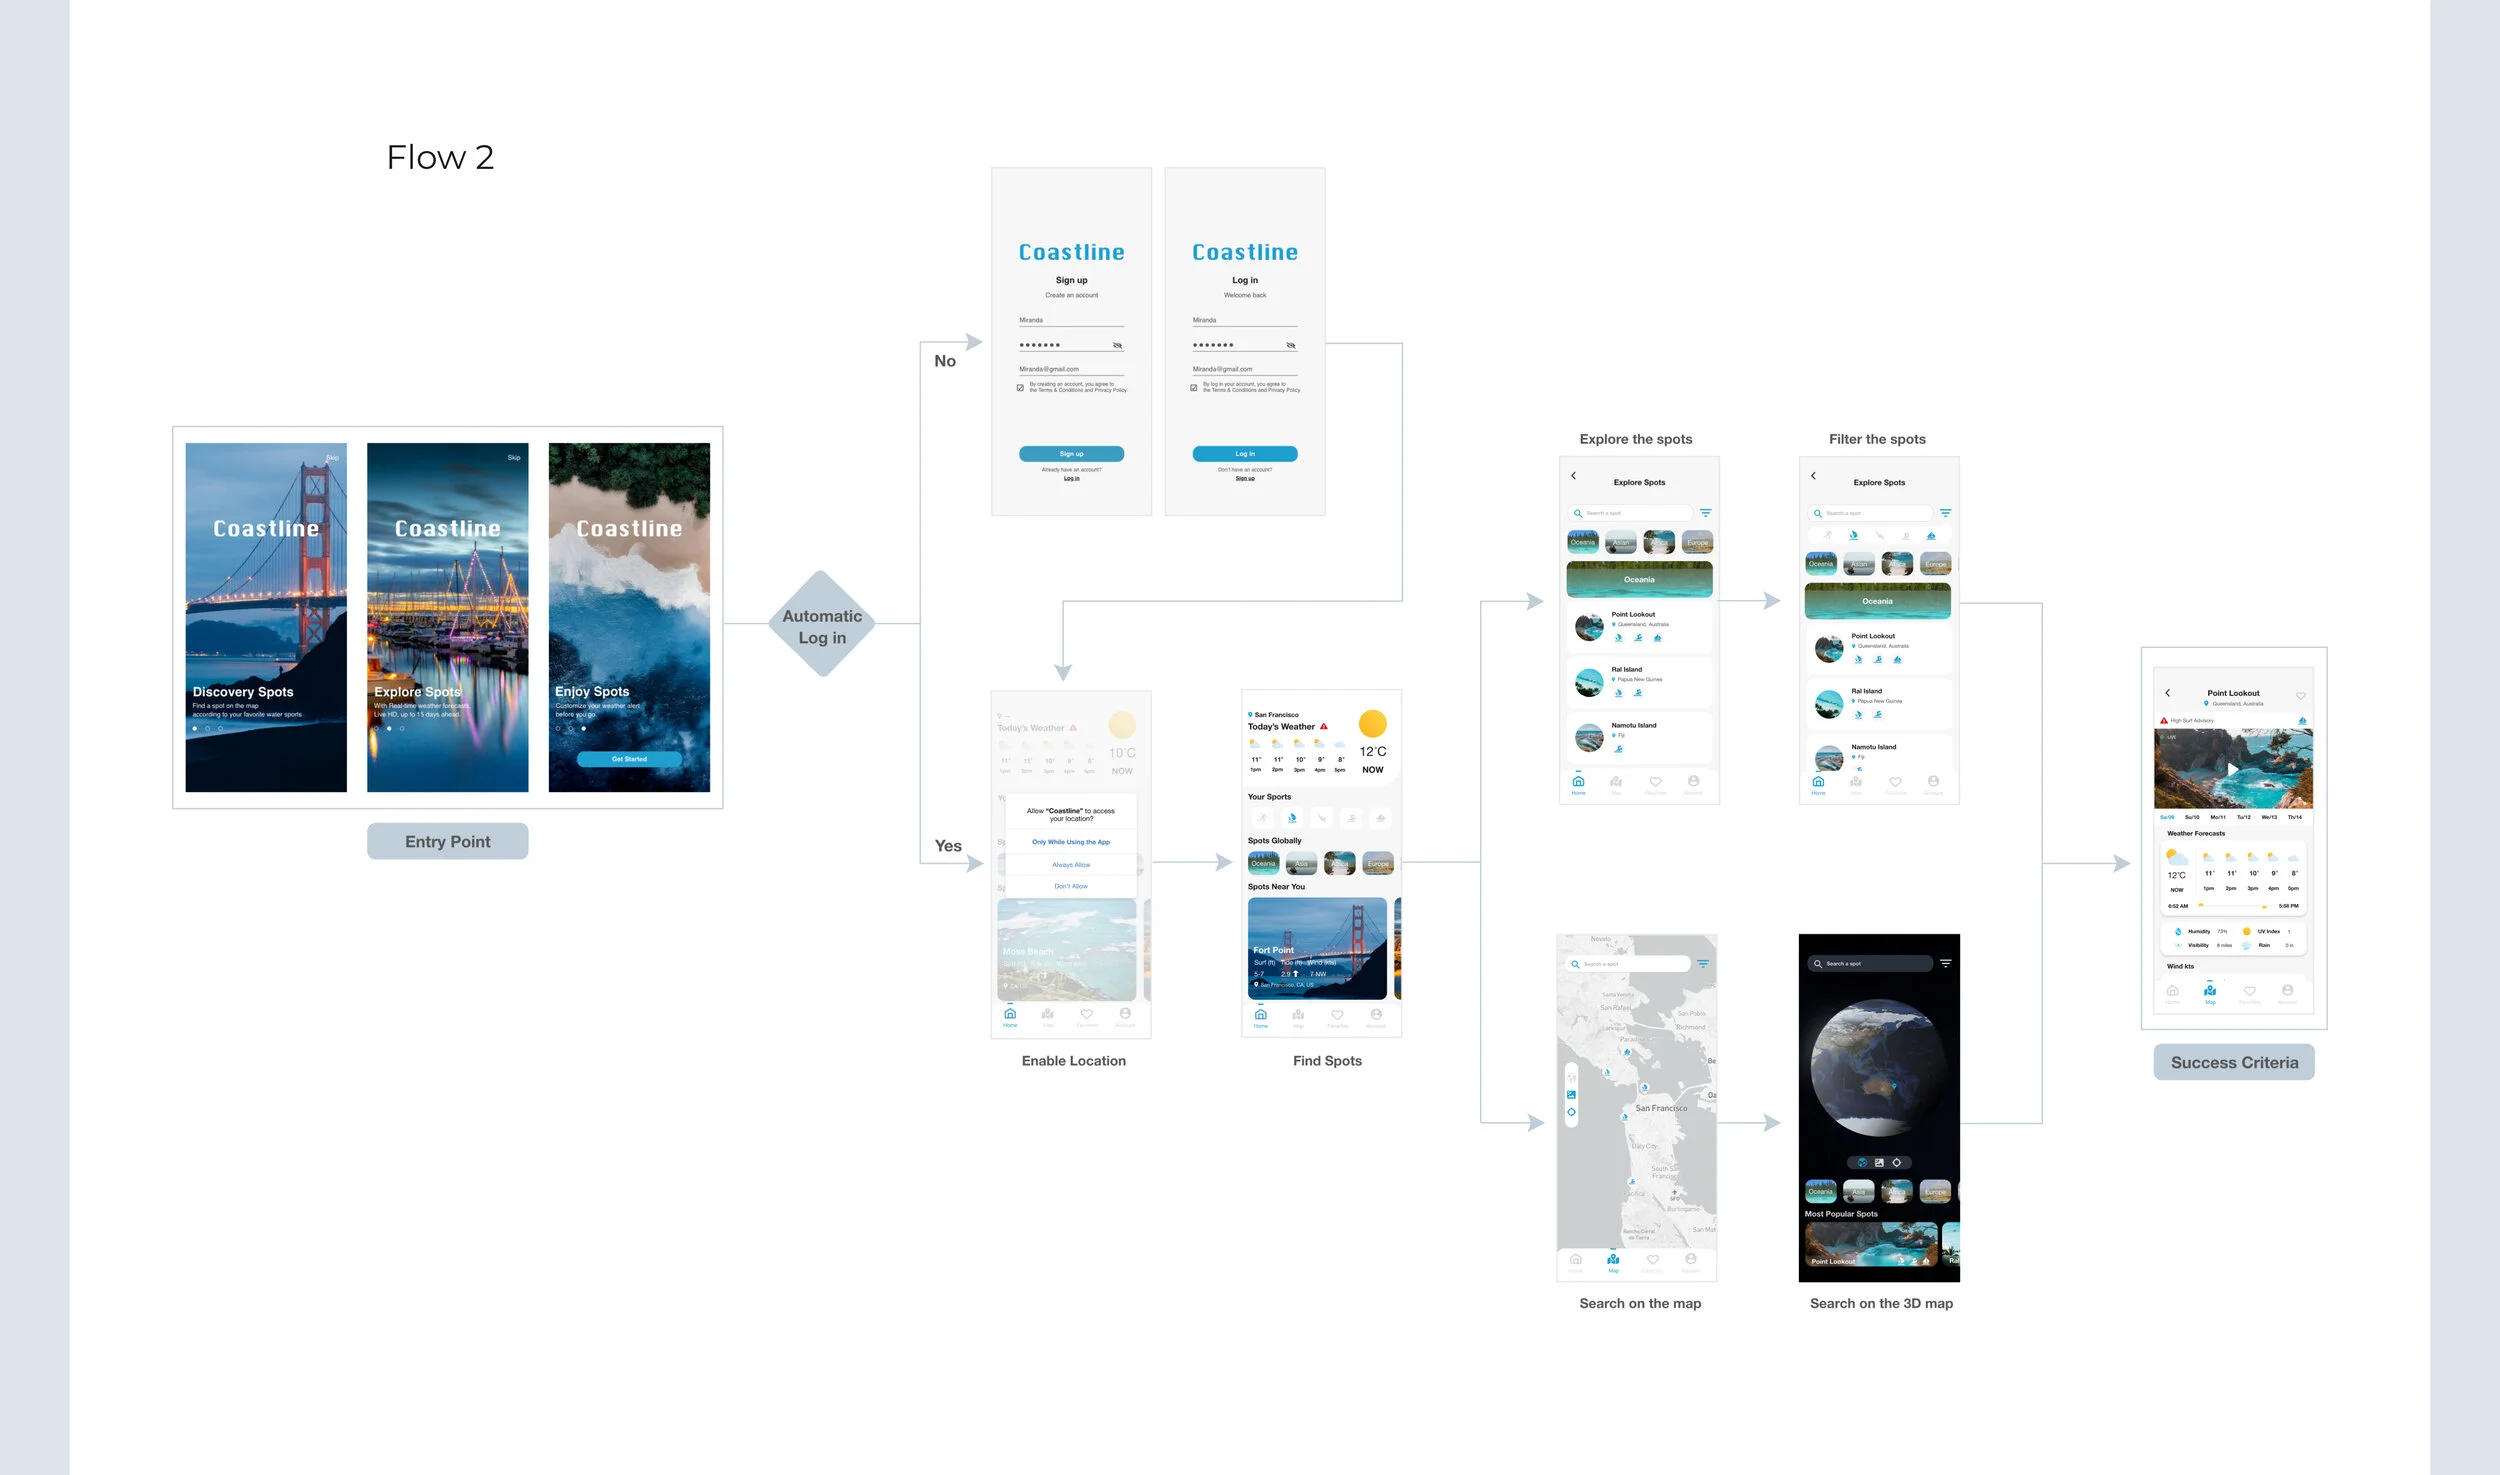
USER FLOWSI created the user flow lays out the user’s movement through the product. Mapping out steps the user takes from the entry point to the success criteria.
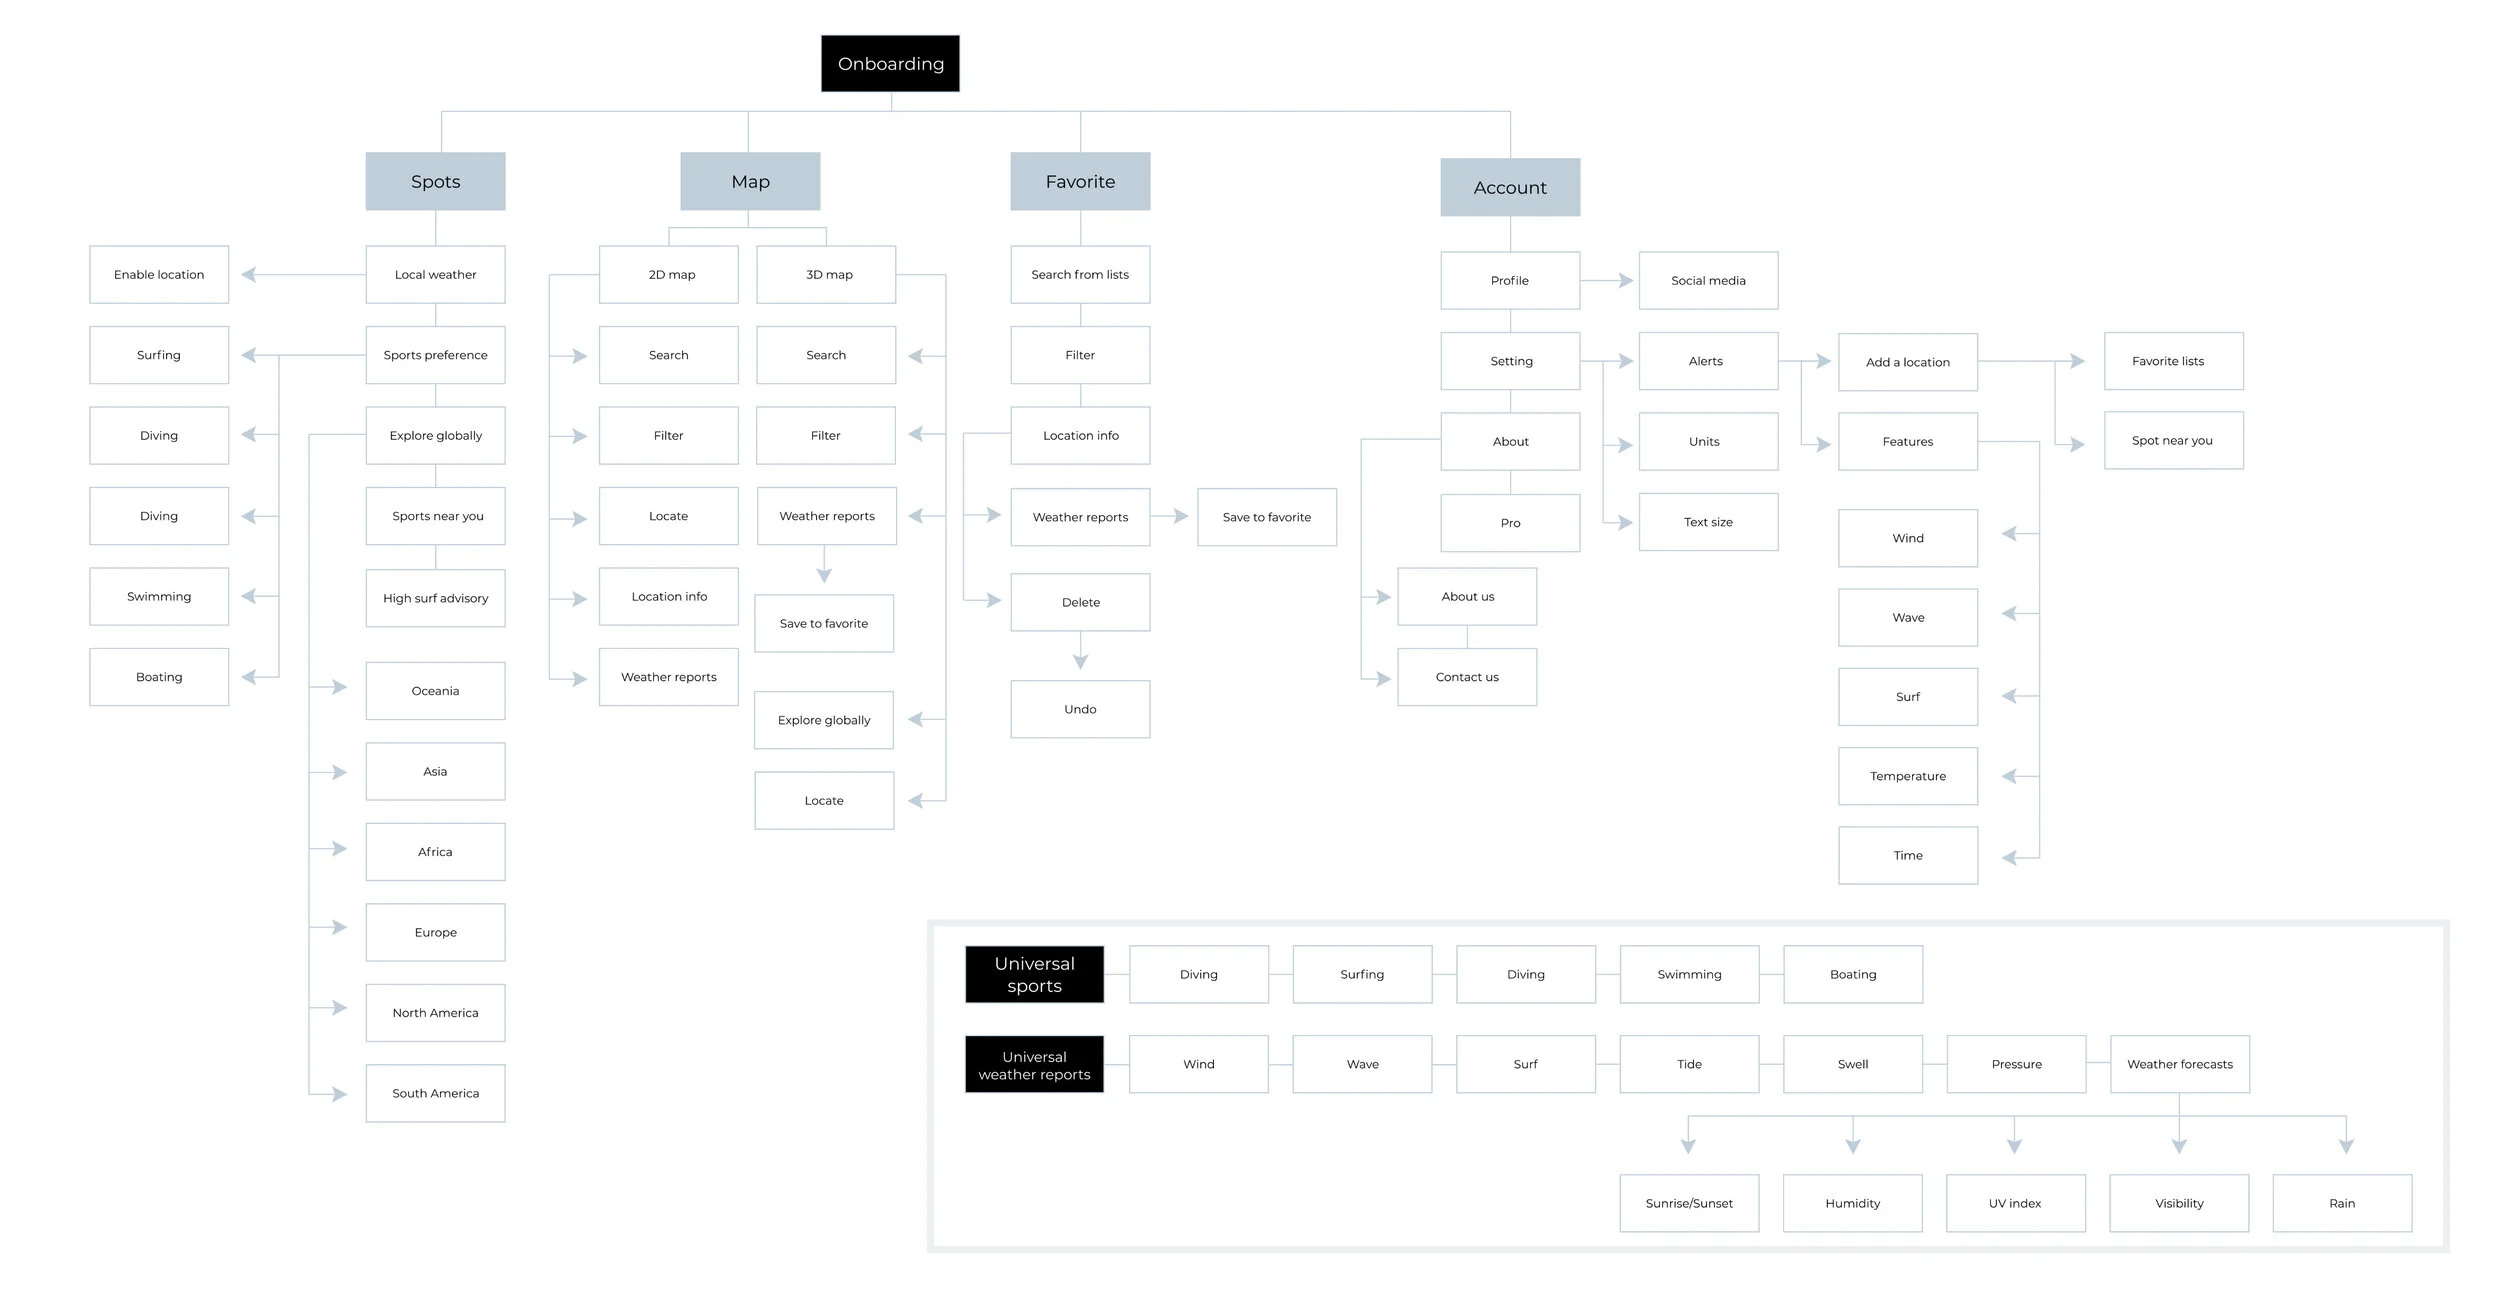
INFORMATION ARCHITECTUREThe IA I created provides a holistic and multidimensional view. Organizing content to help me validate if users would easily access the functionality of the product.

CREATE & ITERATE
I conducted user testing at different stages in the process while designing. Iterating the process based on analyzing test results and keep making improvements for future tests.
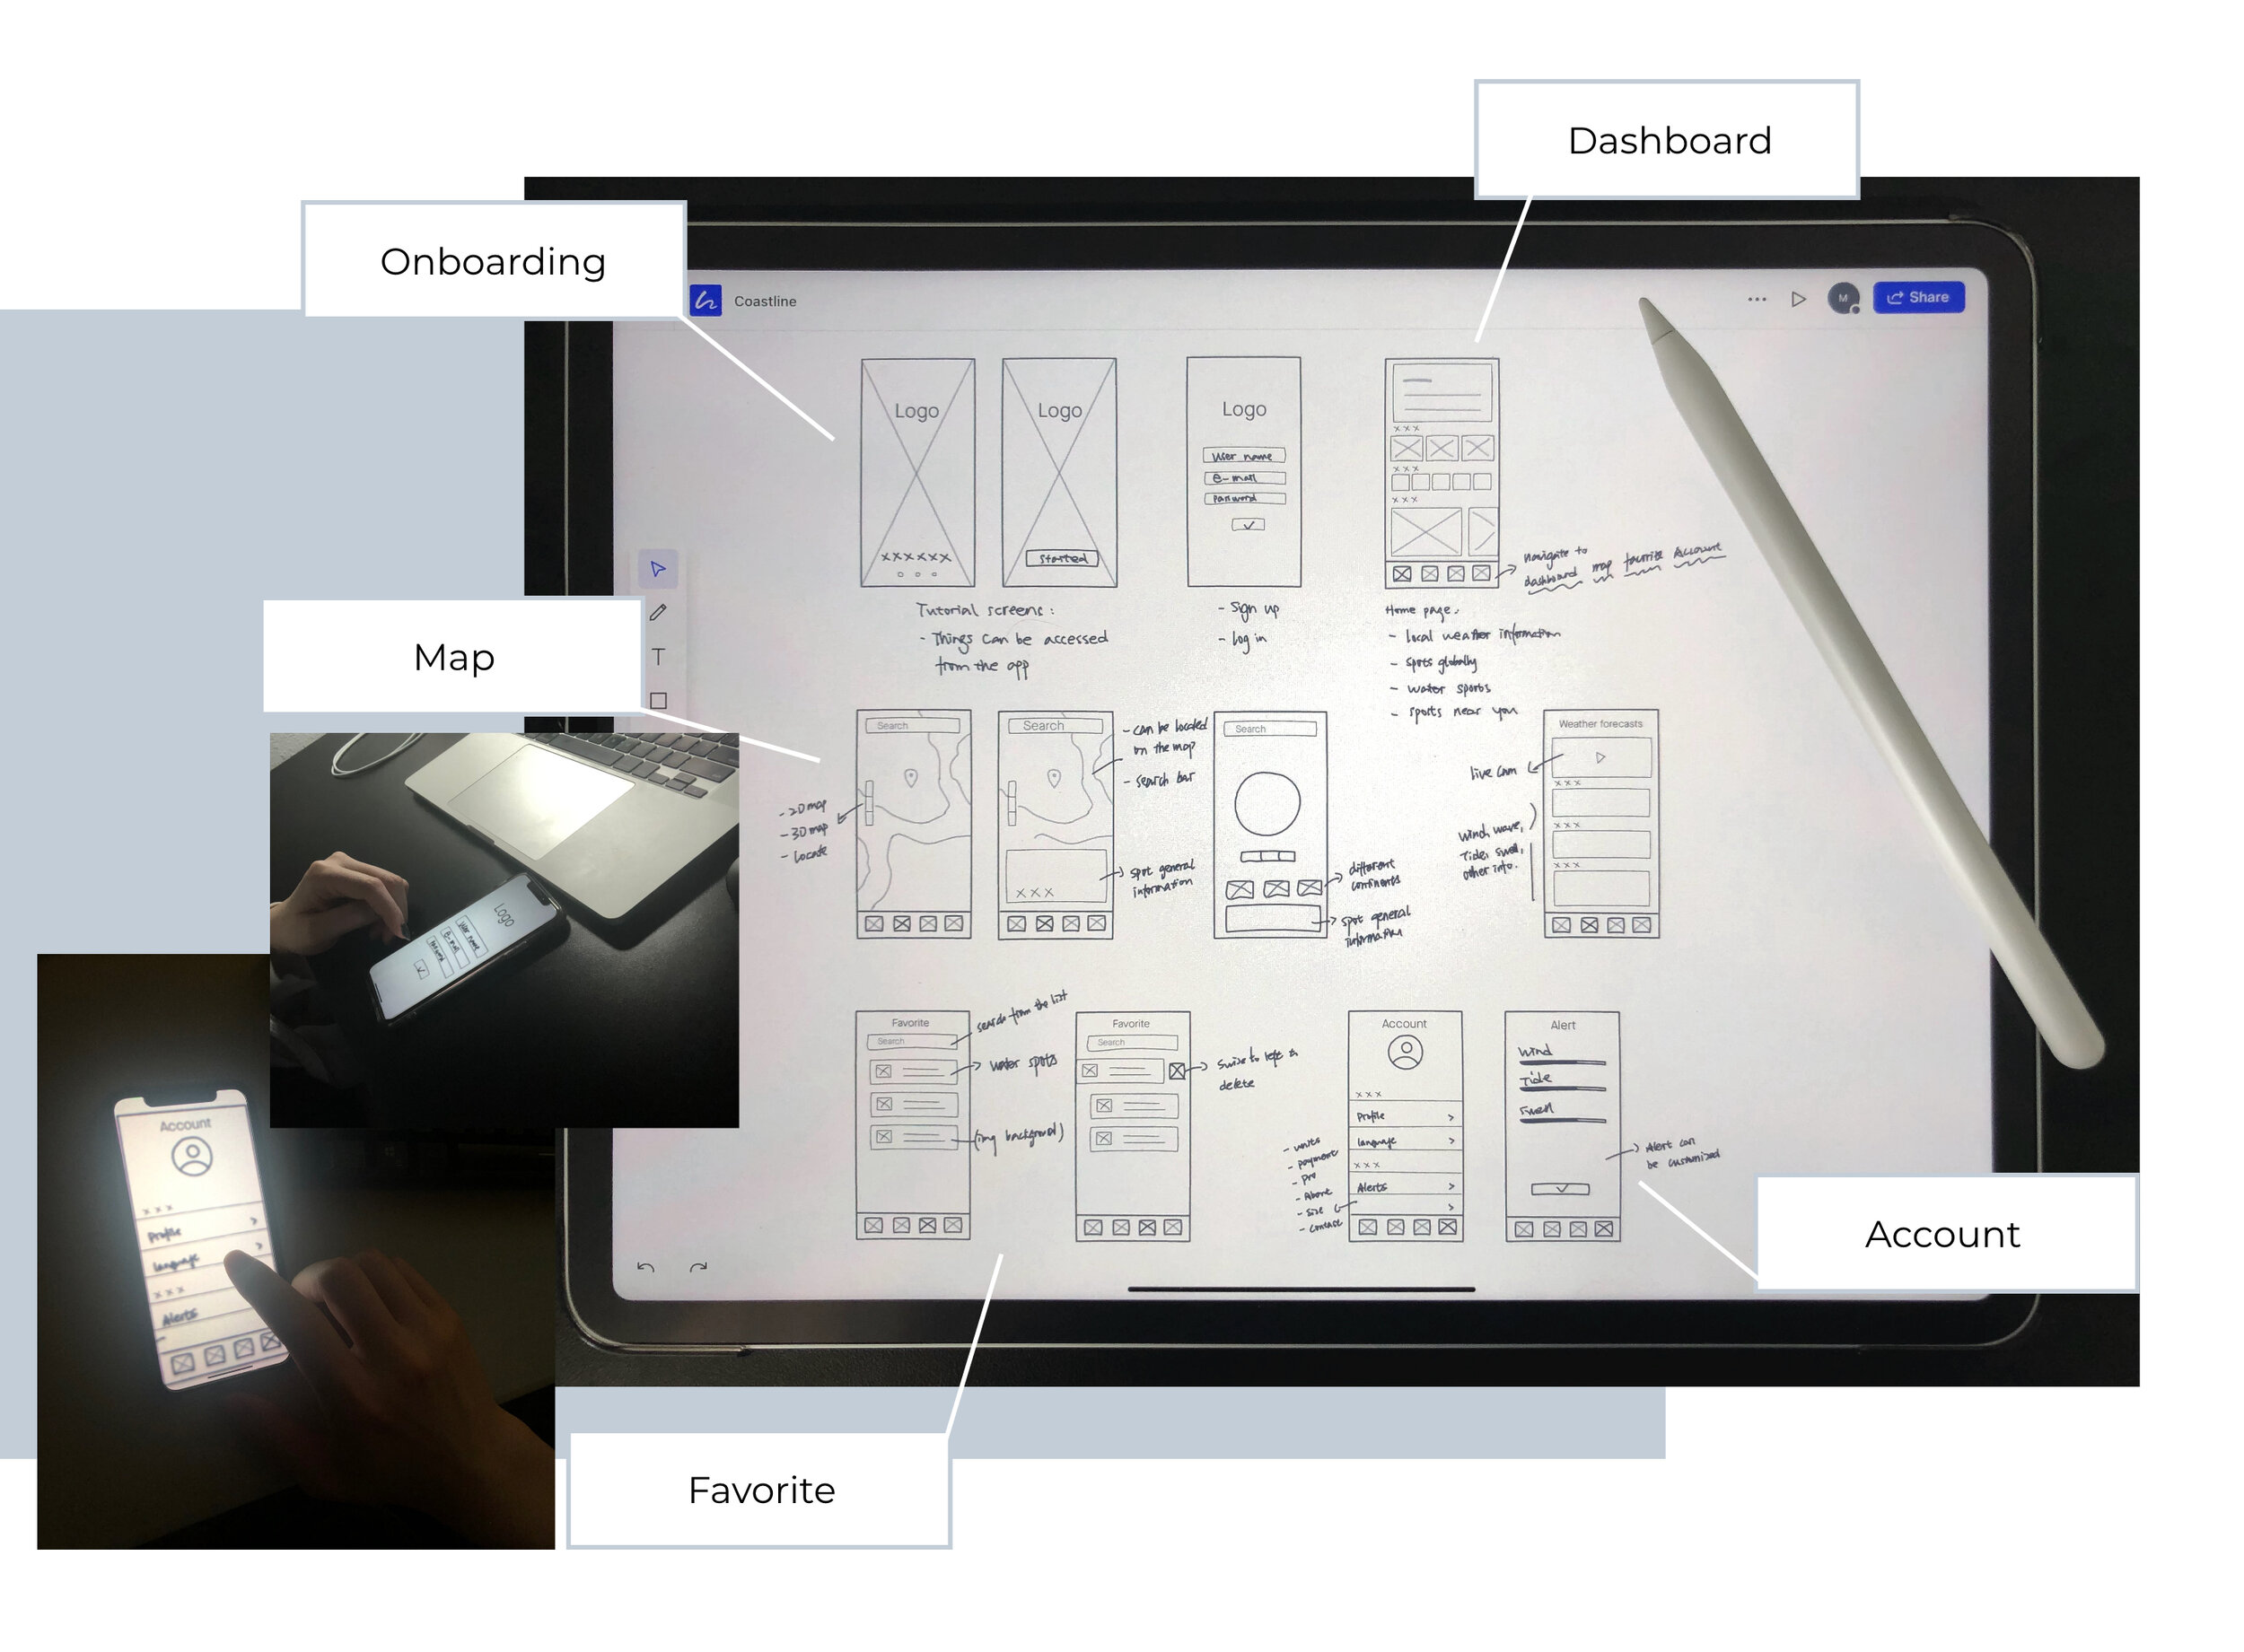
INITIAL SKETCHES I started with mapping the features and building the structure of the product in the low-fi stage. Prototyping the sketches as early as possible to make sure the information structure went smoothly.
MID-FI WIREFRAMESAfter confirming the basic structure, I designed the mid-fi wireframes. With the concepts of primary functions, I used it for user testing with my fellows to get feedback on the functionality problems of the product. To learn if participants are able to complete specified tasks successfully or meet the usability objectives.
ITERATIONMake sure the user can easily complete a task to achieve their goals before moving to the next stage. I conducted user testing in the middle of the design process and improved the display.
Test Result: Local weather conditions take too much space on the top of the screen. In contrast, spots info is inconspicuous for users.
Iteration: After limiting the weather data on the homepage, the interface displays became more functional and clean.
Test Result: Large empty spaces affect user’s perception and make them wonder if there is any part missing.
Iteration: Enlarging the space with a block of text on the screen increases its legibility.
Test Result: The user feels overwhelmed by too much information on the same screen, and it is an obstacle to access the information.
Iteration: Rearrange the information layout for better accessing the weather reports.
Test Result: previously, the users need to follow two steps to customize weather features.
Iteration: To simplify the process and enhance the performance of the task. I merged it into one screen.
HIGH-FI PROTOTYPES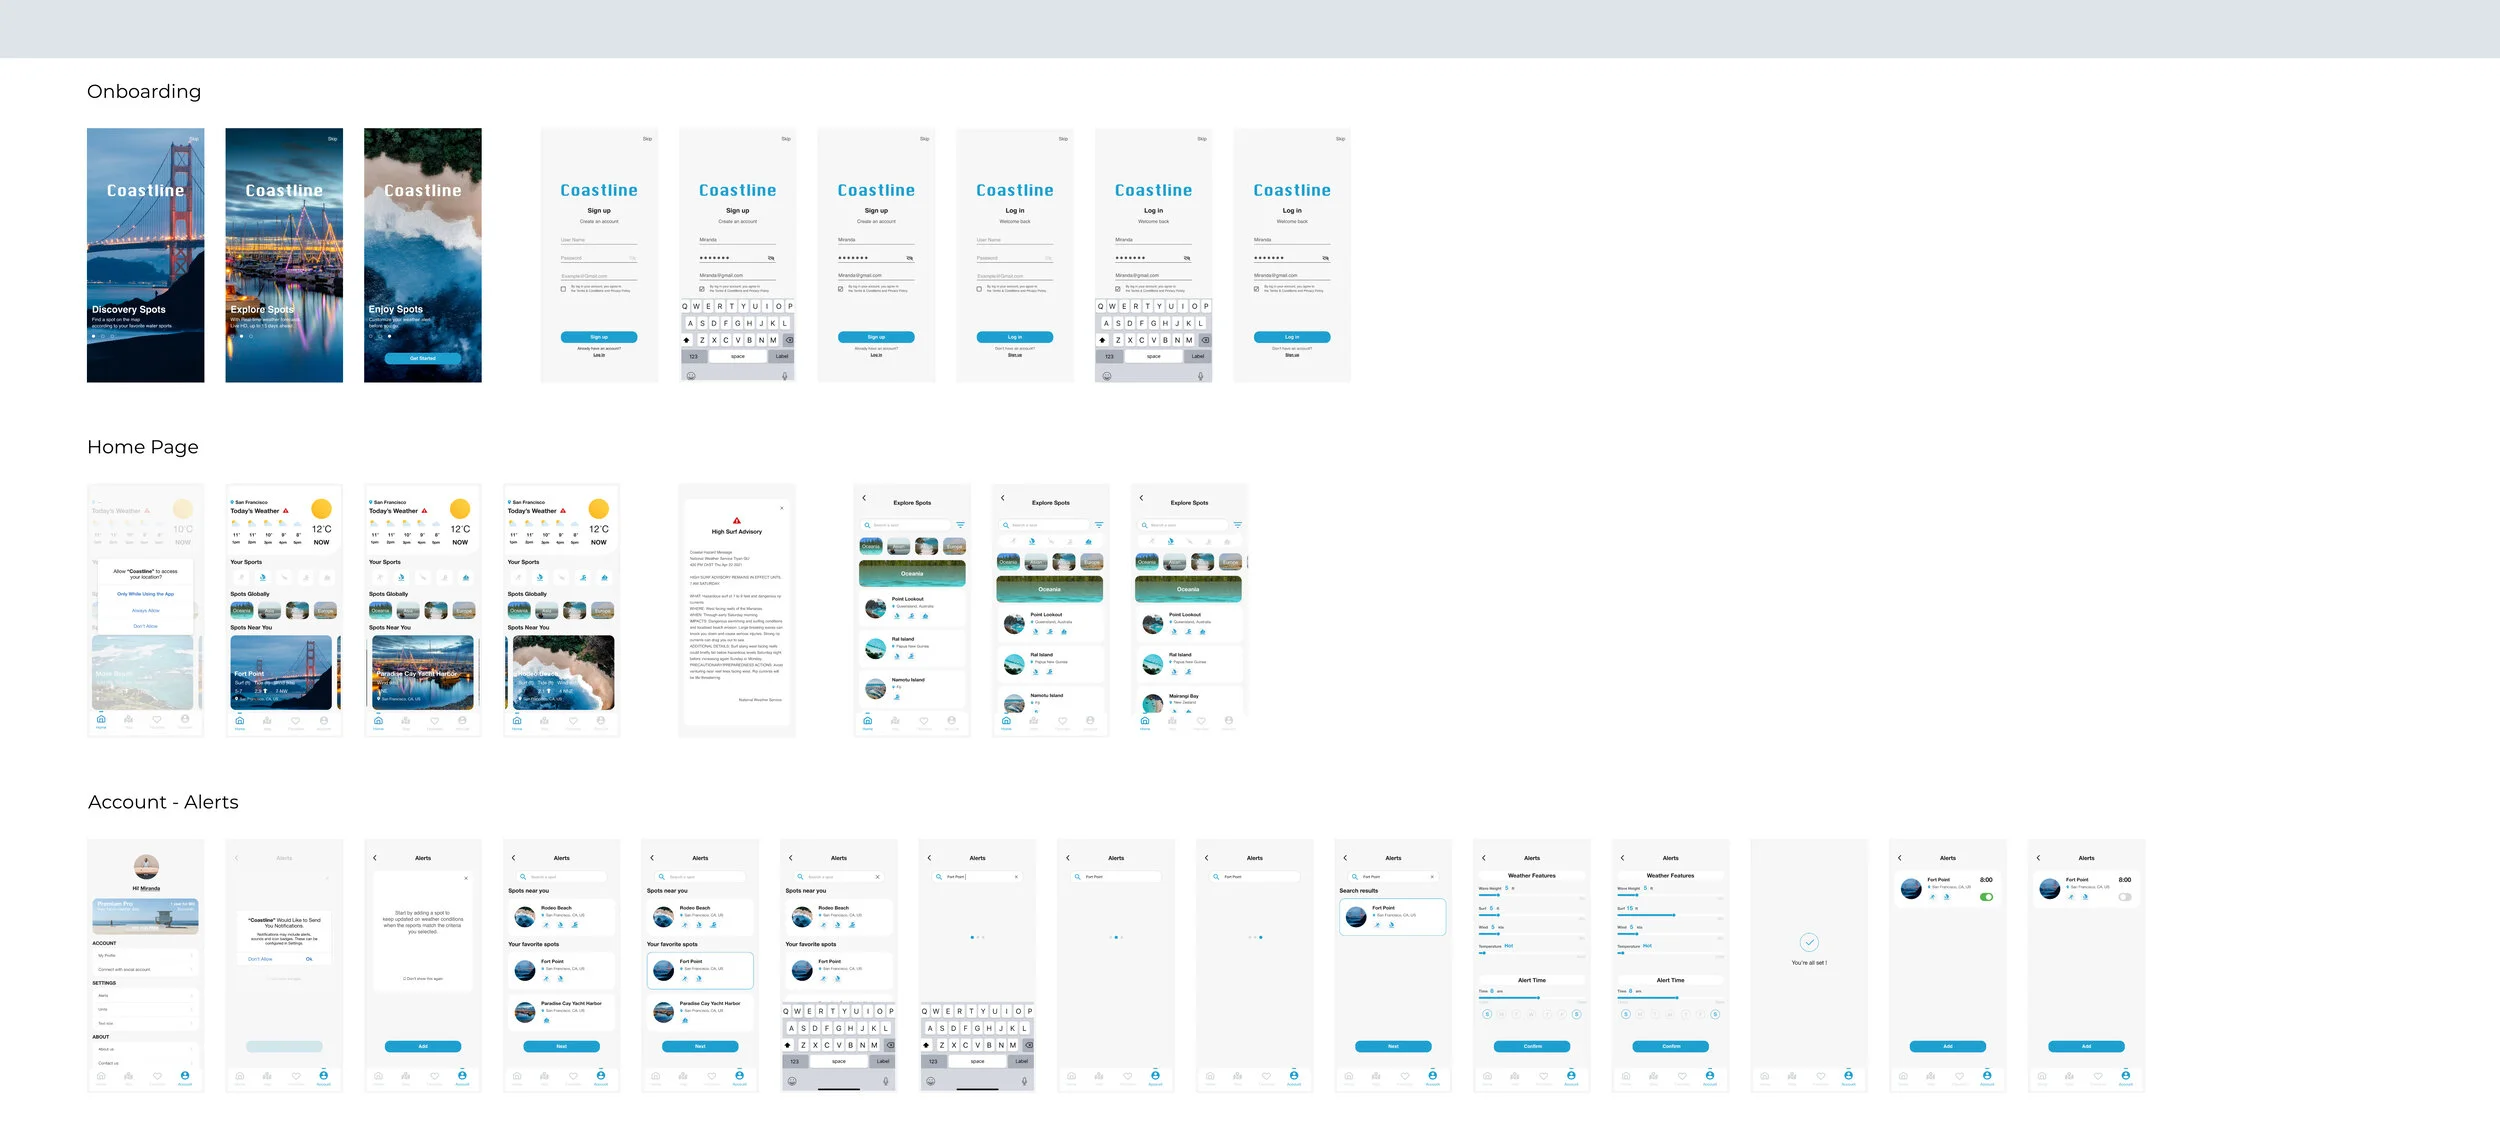
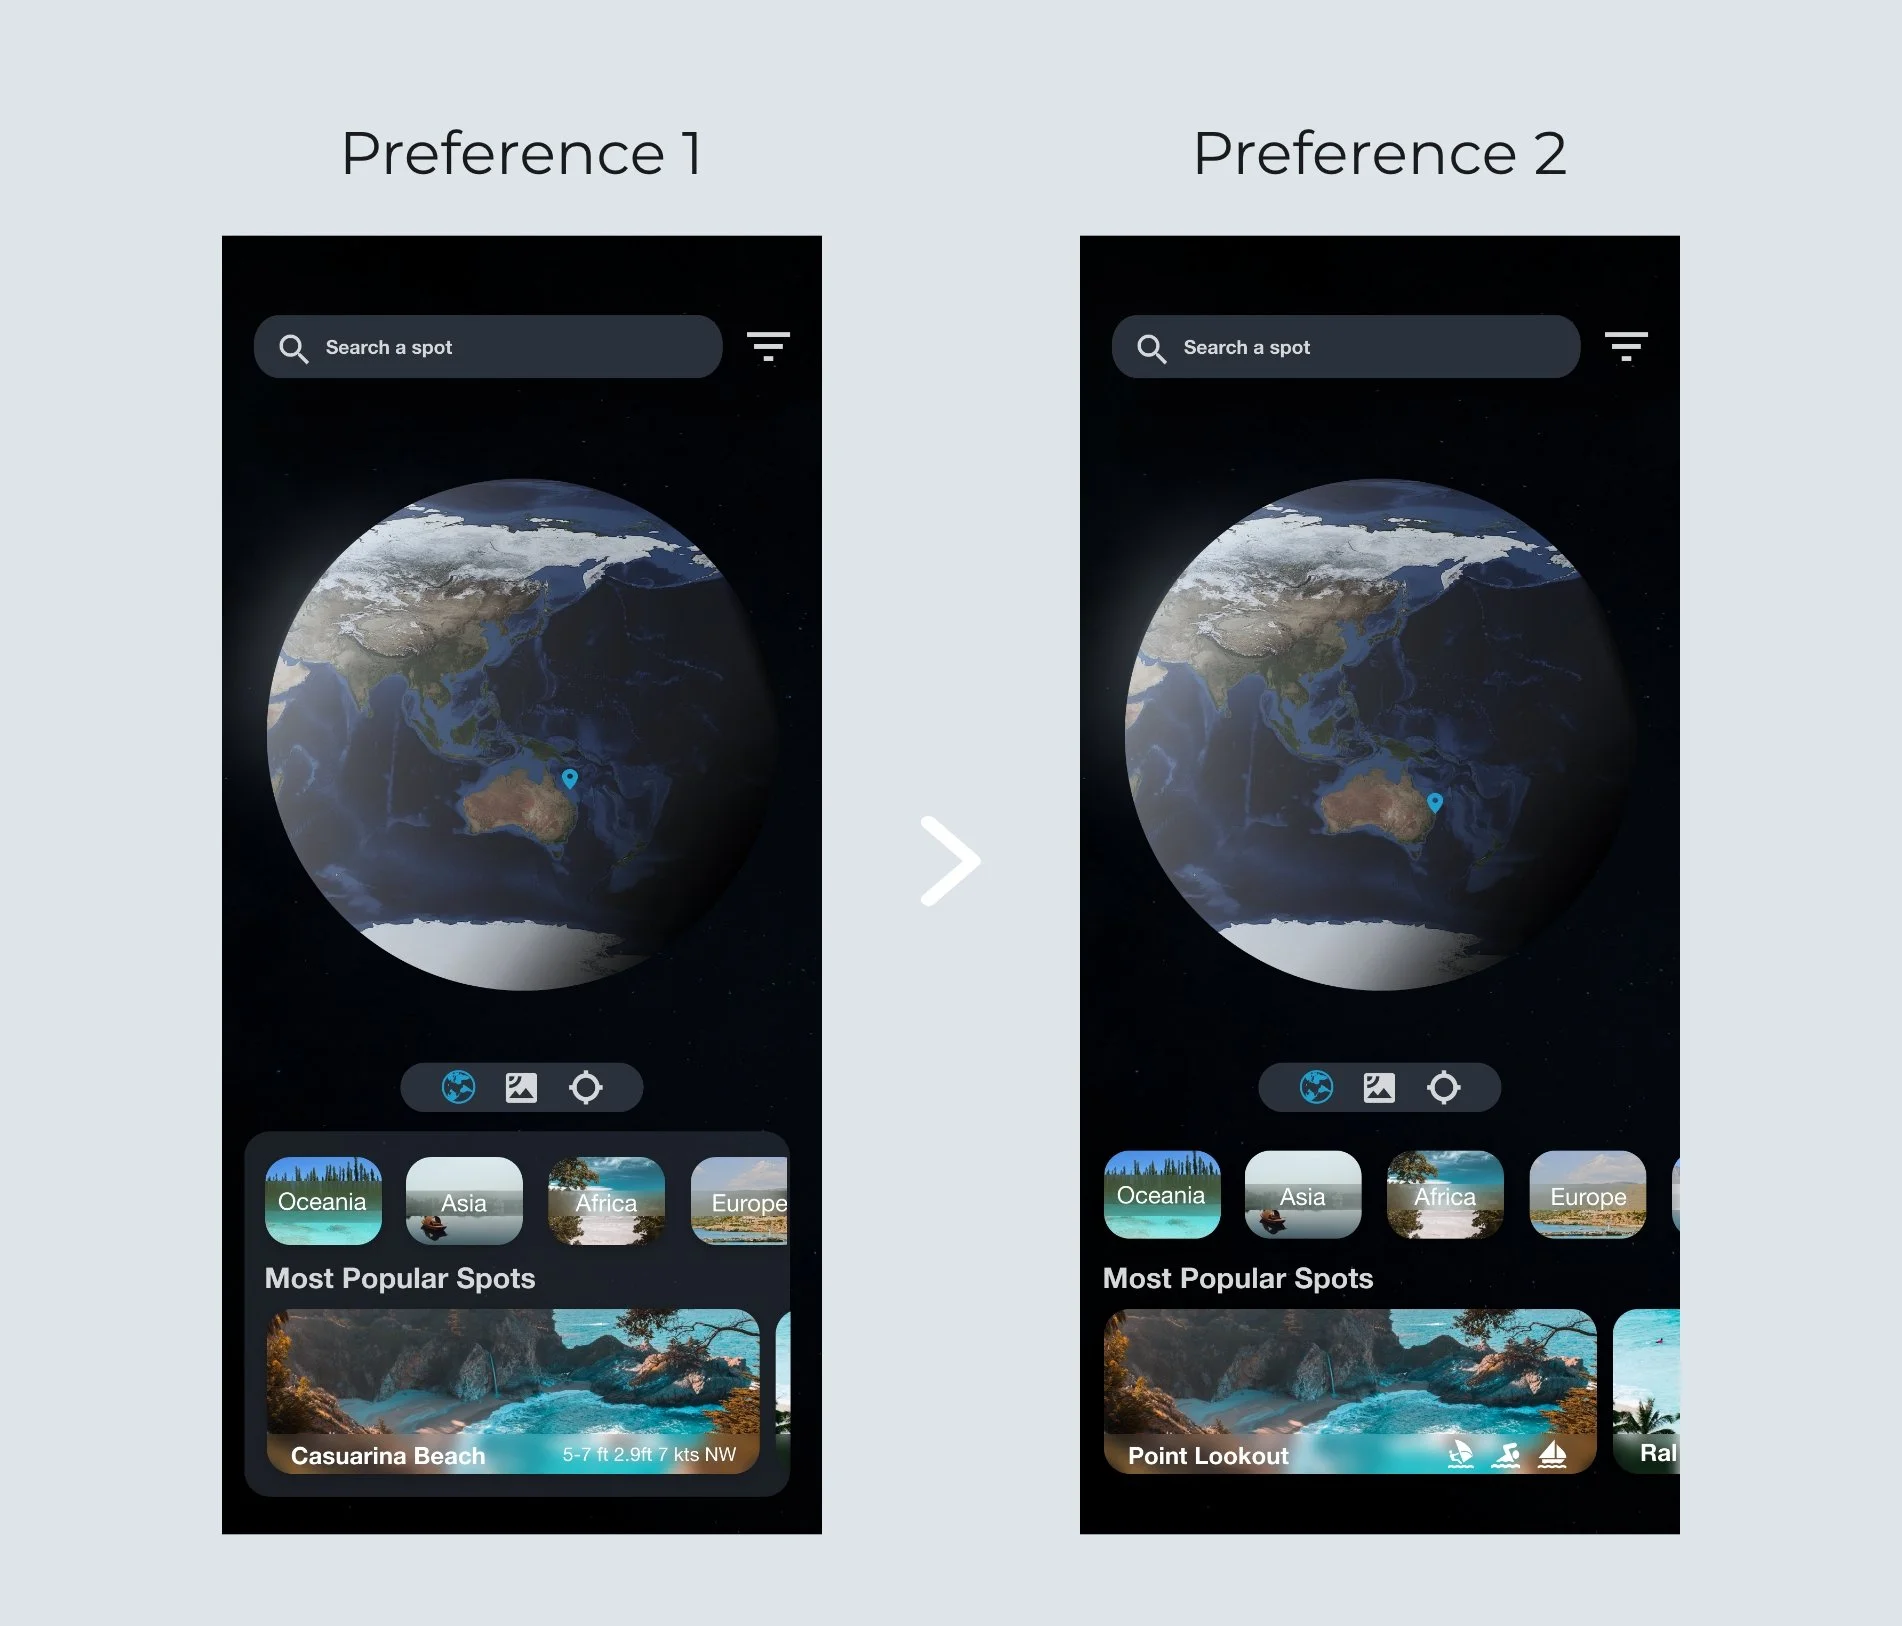
PREFERENCE TESTINGI conducted preference testing to learn which layout potential users would prefer. It also helps me get more qualitative feedback from testing to back my design.
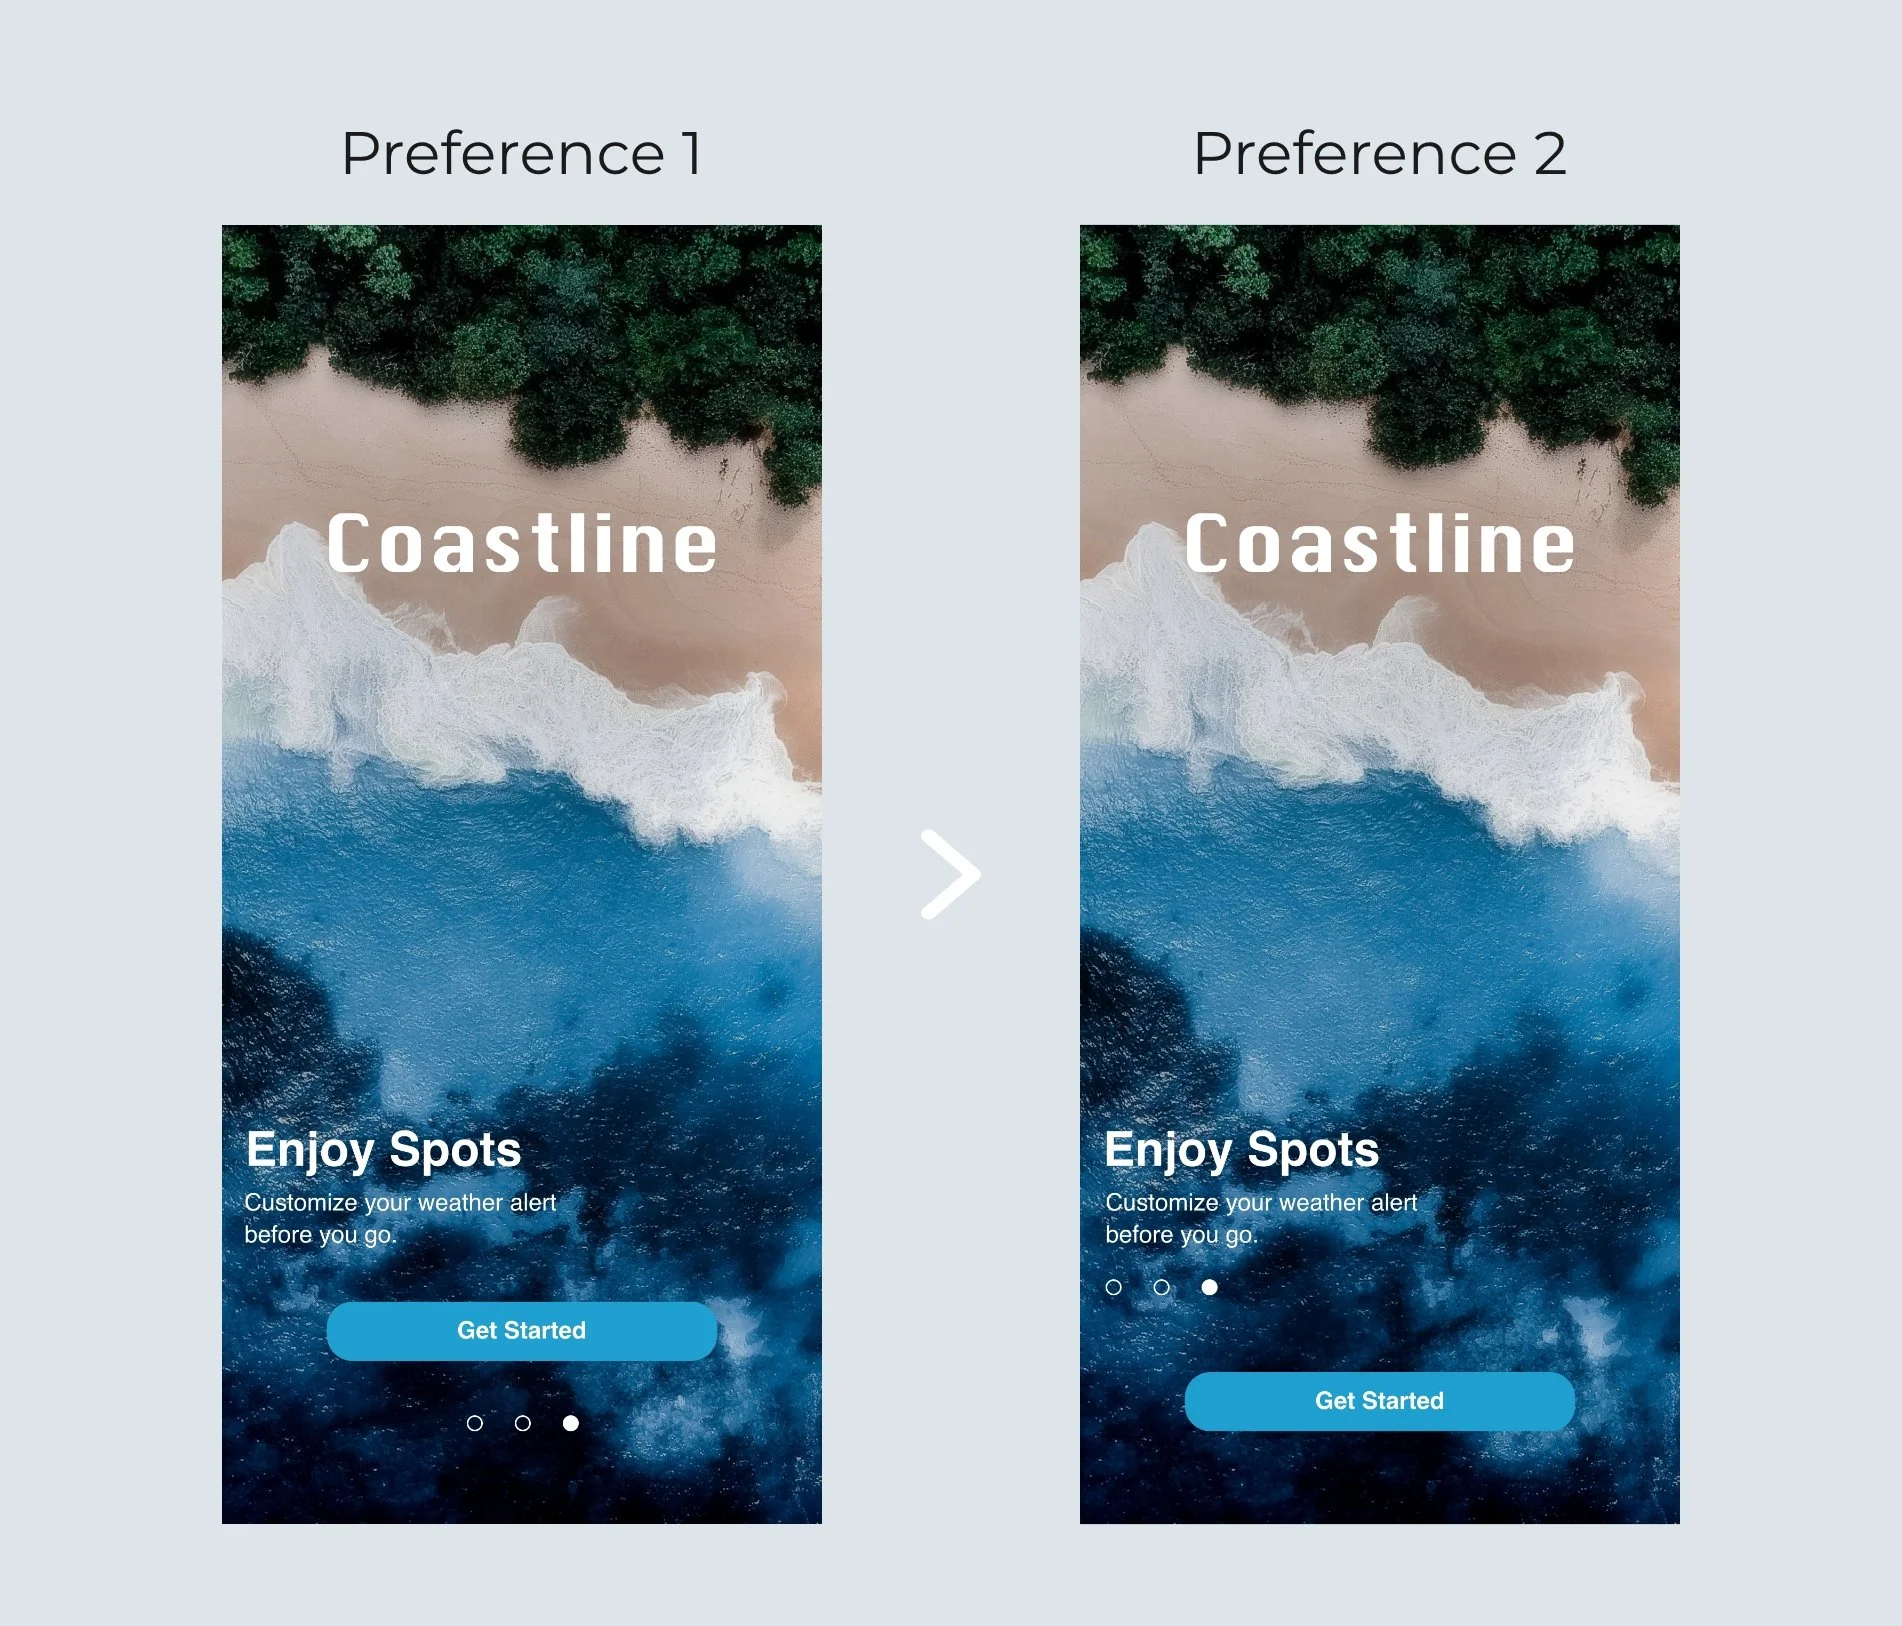
Test Result: There are 24 participants. 75% of participants chose preference 2, and 25% chose preference 1.
Finding: They think the content of preference 2 is more consistent to some degree.
Test Result: 60% chose preference 2, and 40% chose preference 1 of the total of 13 participants.
Finding: The difference between them is not statistically significant. Participants think the layout of preference 1 is more standout than preference 2.
THE STYLE INSPIRED
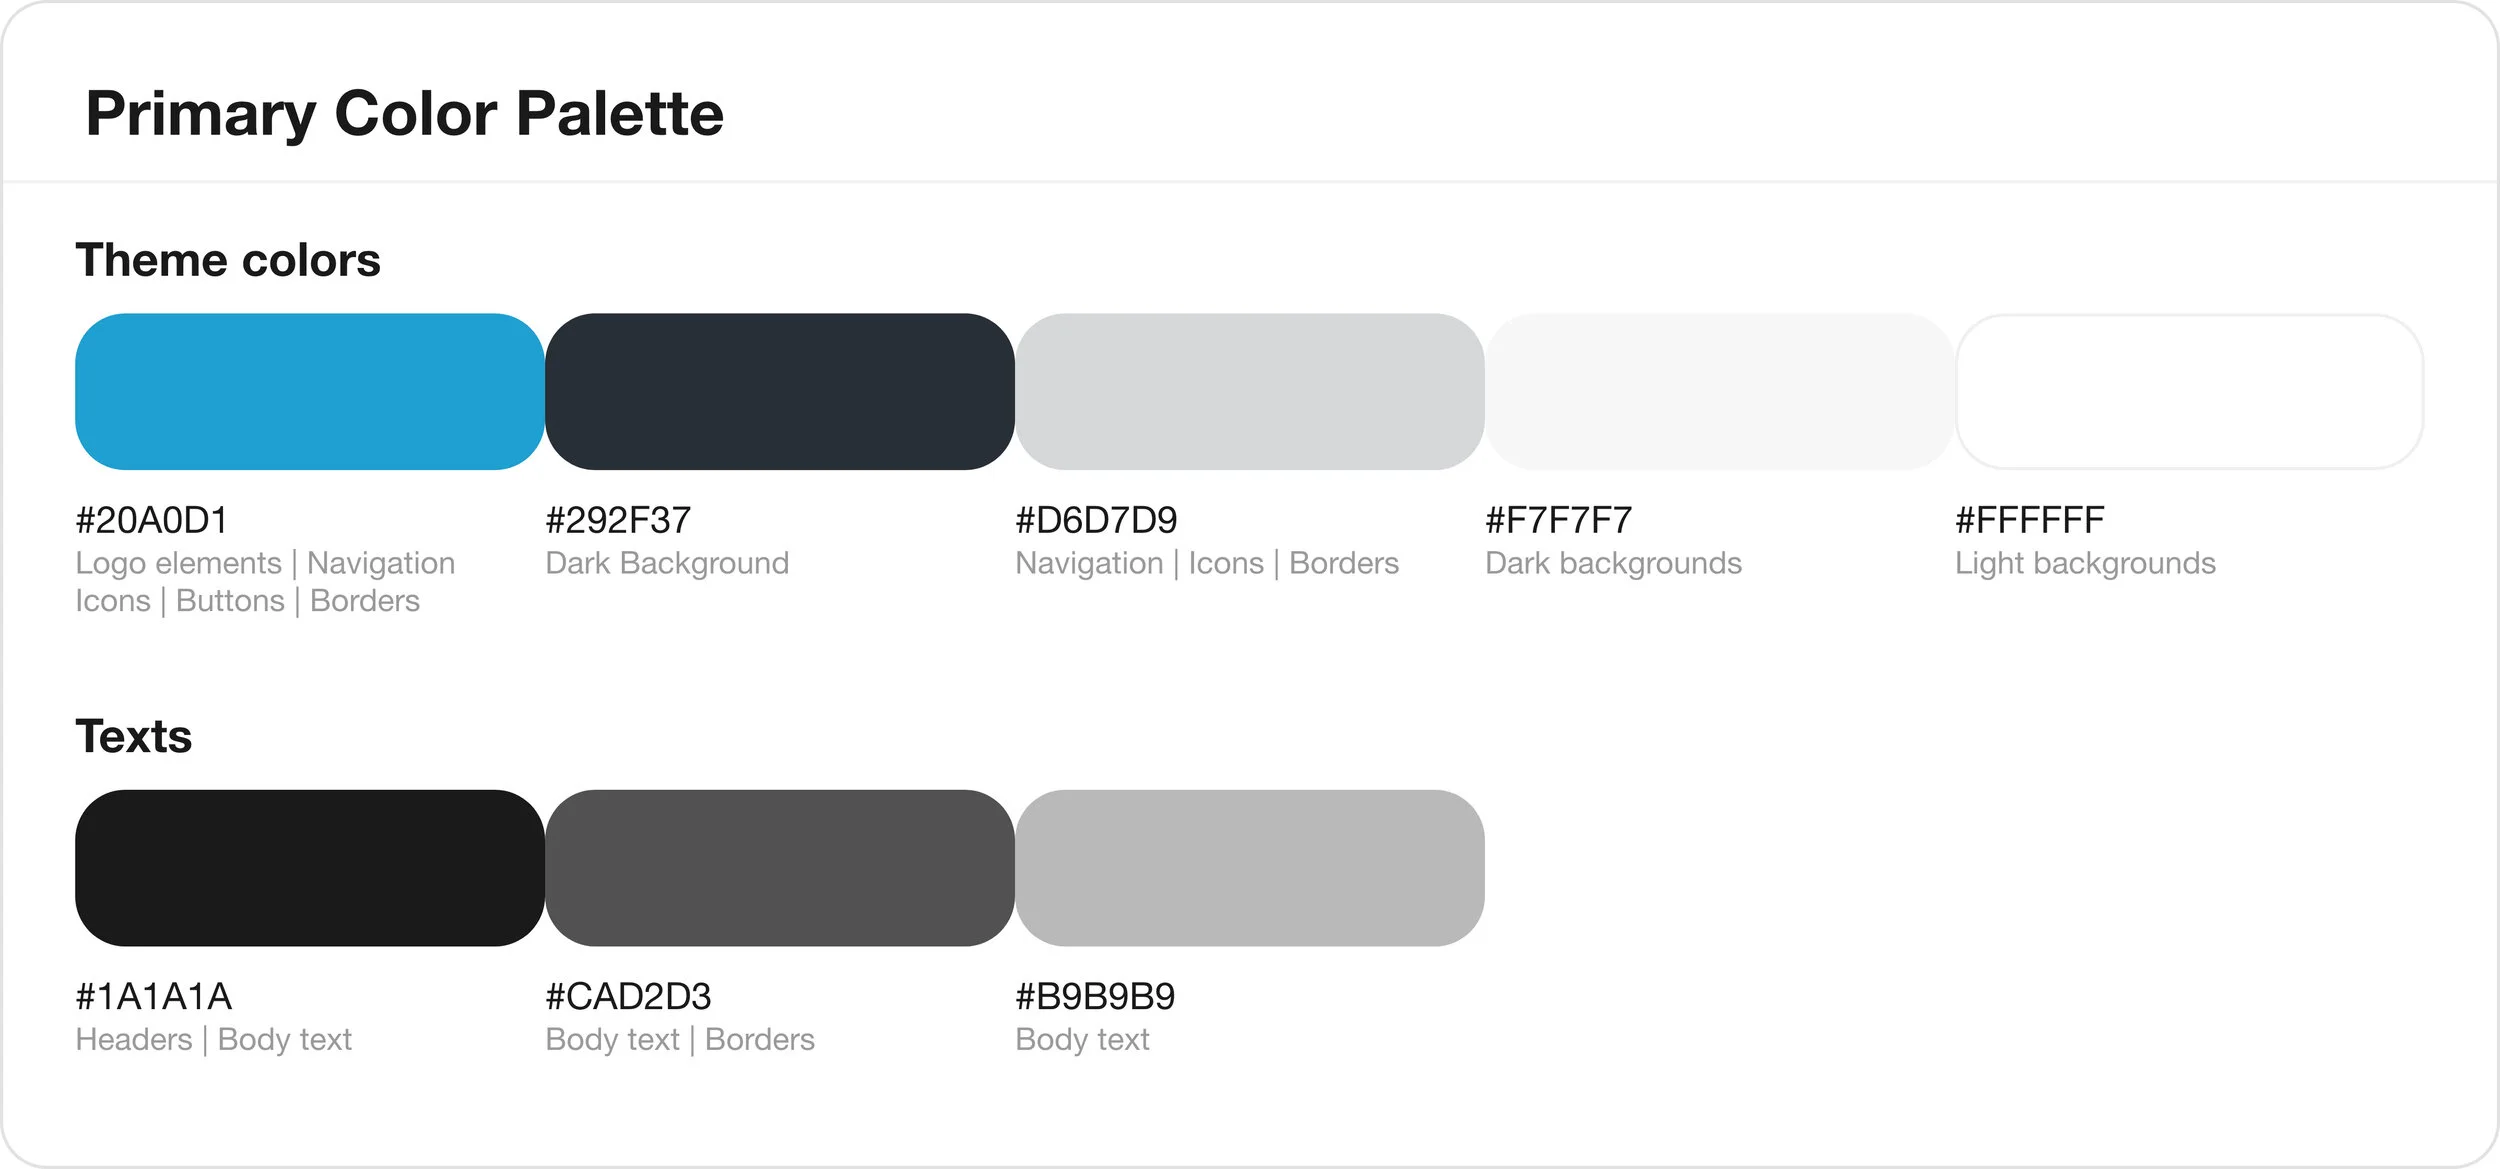
The final look I achieved took into consideration of the fundamental color concepts, and typography principles.Blue as the primary color always related to the ocean, it brings trust, peace, safety feeling to users.
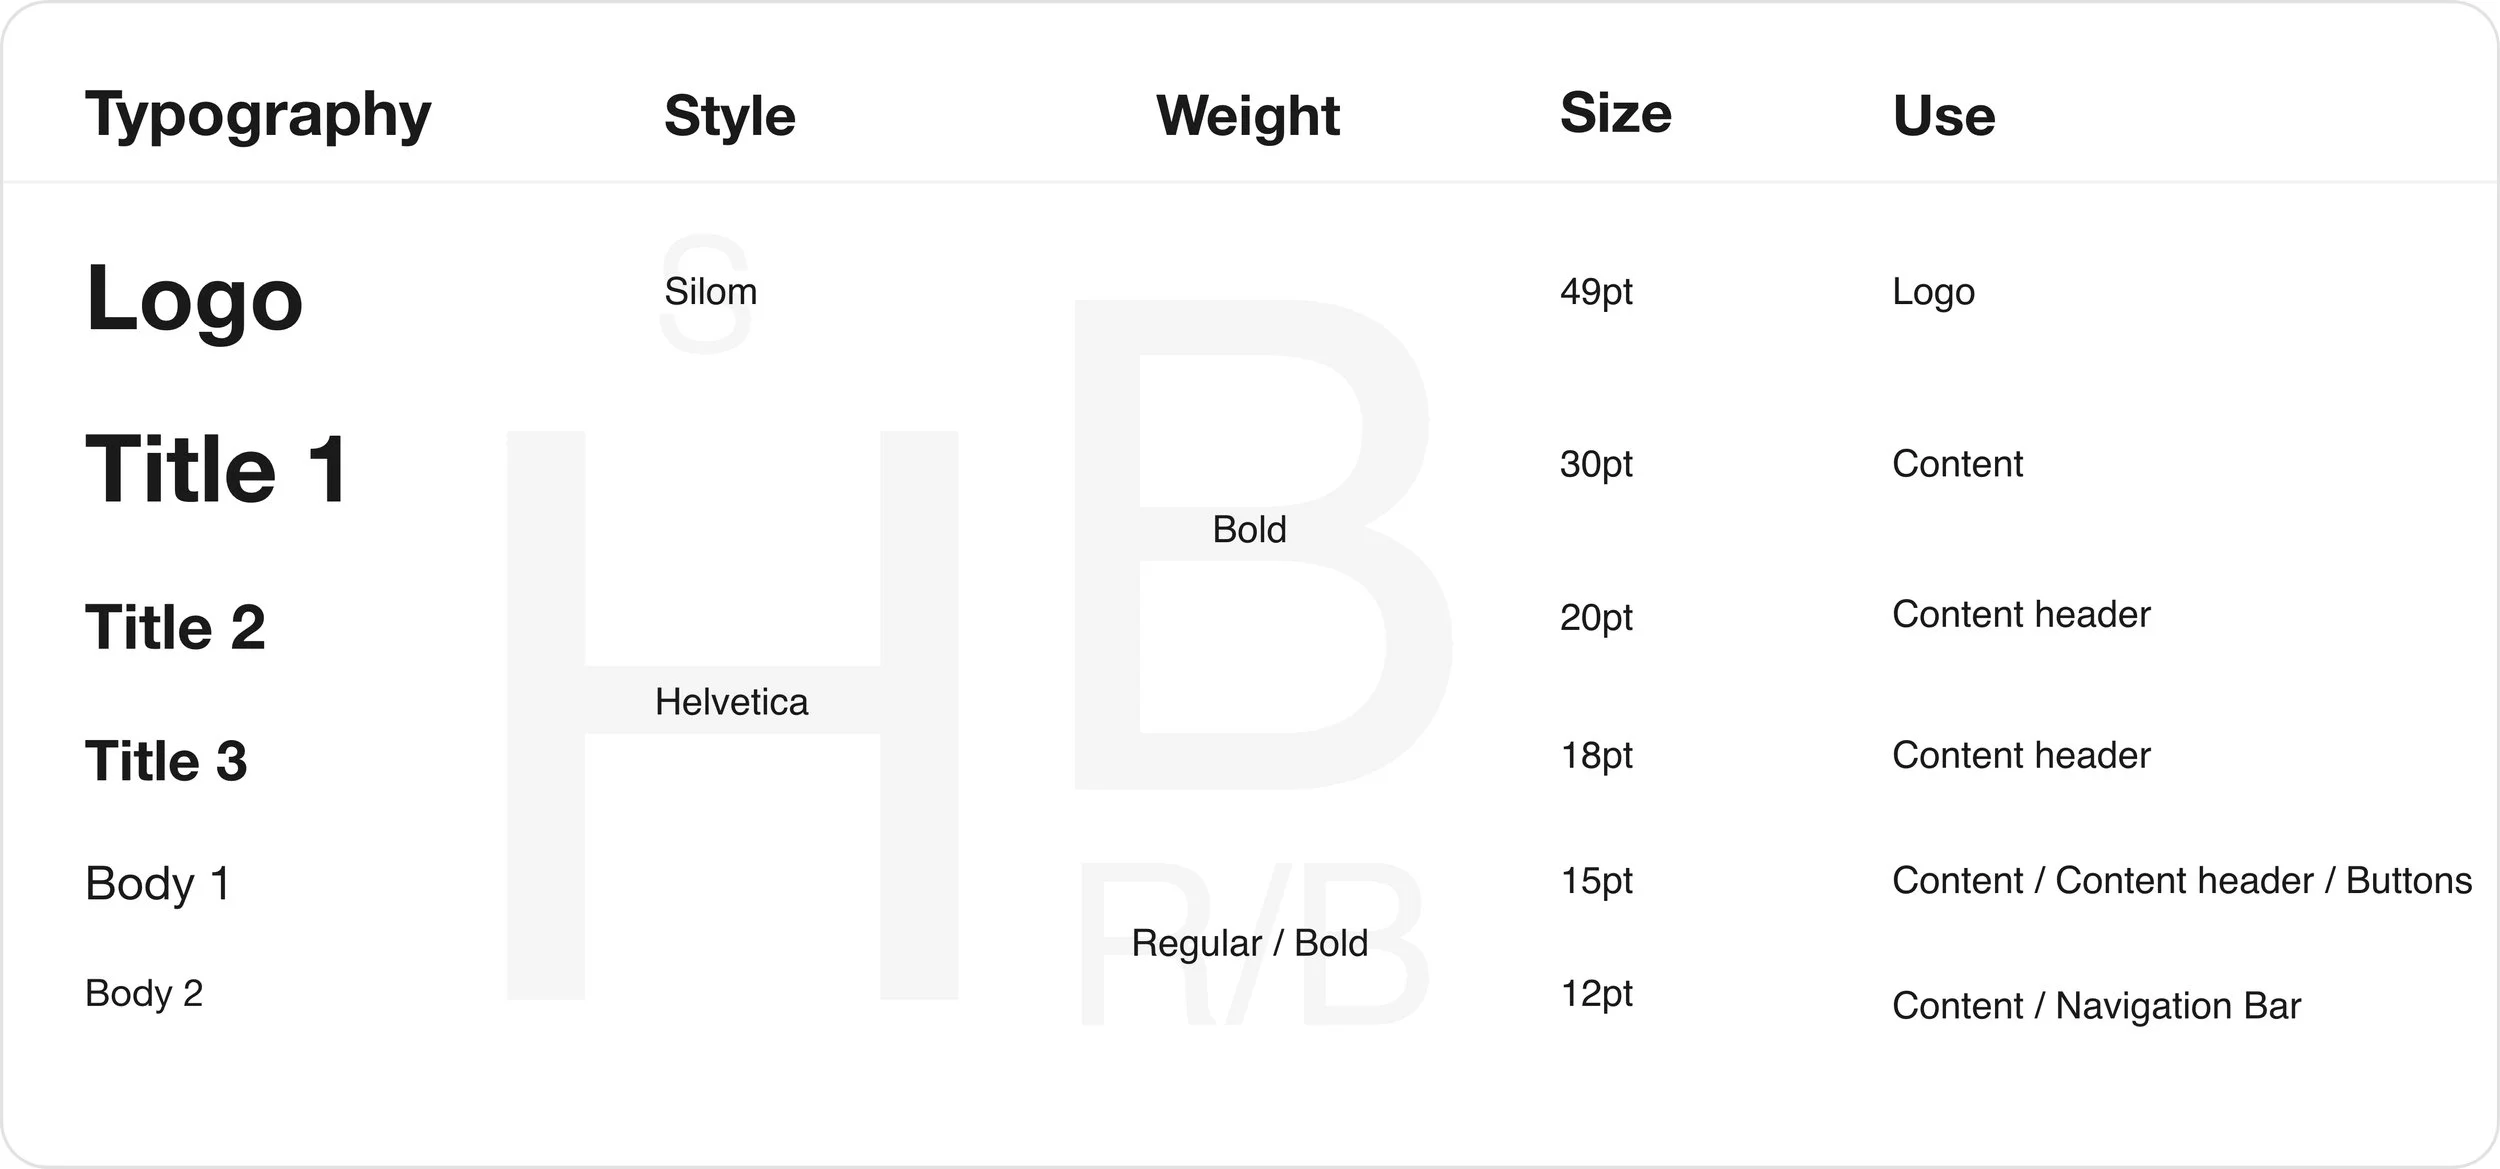
Two types of font to keep the design uncluttered and straightforward. Adapting different fonts size in the hierarchy to keep the context organized and consistent.
PROJECTING LEARNINGIteration is importantWith the process kept iterating, users can enjoy a better user experience than before. But even with that, new problems will keep arising. That's why getting feedback from users and keeping iterating the product is crucial, which is also the core of a good product.
